Chapter VII
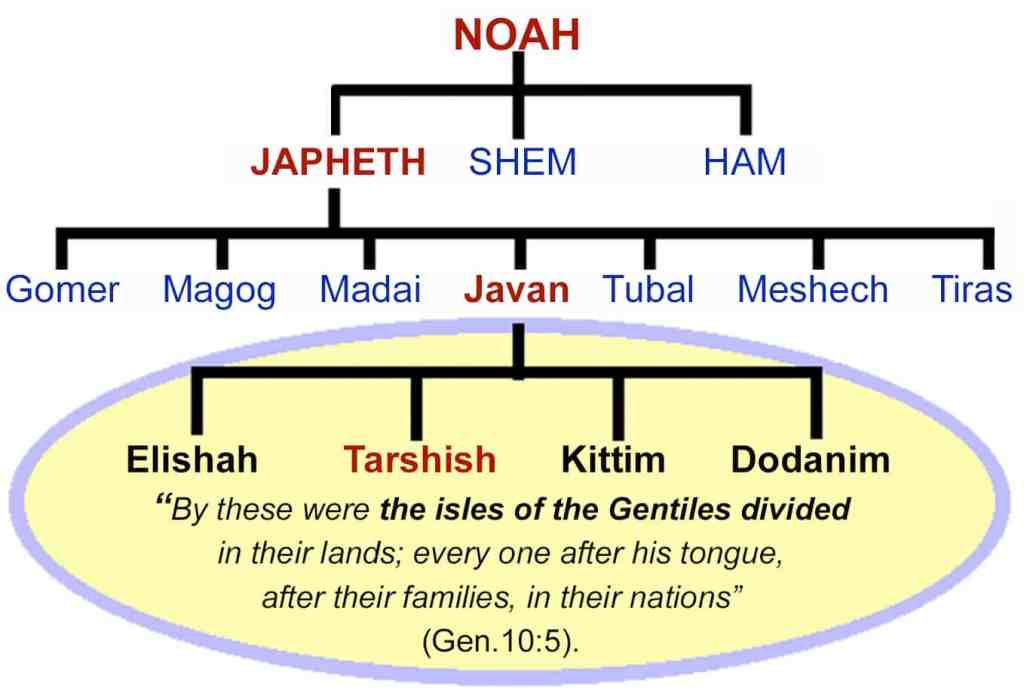
Javan is the fourth and middle son of Japheth and his sons are the second and last recorded group of grandsons from Japheth in the Bible.
Genesis 10:4-5
Douay-Rheims 1899 American Edition
4 ‘And the sons of Javan: Elisa and Tharsis, Cetthim and Dodanim. 5 By these were divided the islands [or isles]… in their lands… and their families in their nations.’
Living Bible
‘The sons of Javan:
Elishah, Tarshish, Kittim, Dodanim.
Their descendants became the maritime nations in various lands, each with a separate language.’

1 Chronicles 1:7
English Standard Version
‘The sons of Javan: Elishah, Tarshish, Kittim, and Rodanim.’
The sons of Javan are associated with islands and the sea.
Dodan is called Rodan in 1 Chronicles. Recall a similar situation with Gomer’s son Riphath and Diphath, regarding the reverse transliteration of the first letters R and D. Either another scribal error has occurred, with a different reference to the same Dodanim who once lived on the Greek Island of Rhodes… or there is an additional son of Javan, or even a grandson, via Javan’s son Dodan – refer Chapter V Gomer: Continental South East Asia.
On a personal note: I paused, contemplating which word to use to describe the situation and checked transcription which had come to mind, though I did not know what it meant or whether I had made it up. I then found the following definition, much to my surprise.
‘Transcription is the first of several steps of DNA based gene expression in which a particular segment of DNA is copied into RNA (especially mRNA) by the enzyme RNA polymerase. A molecule that allows the genetic material to be realized as a protein was first hypothesized by Francois Jacob and Jacques Monod. Severo Ochoa won a Nobel Prize in Physiology or Medicine in 1959 for developing a process for synthesizing RNA in vitro with polynucleotide phosphorylase, which was useful for cracking the genetic code.’
I was struck by the coincidence and perhaps significance of a genetic explanation and the utilisation of the letters D and R for DNA and RNA, with the first letters for D-odan and R-odan (and previously for R-iphath and D-iphath). I found this coincidence interesting, but had no reason to pursue the mRNA aspect. Though it certainly did attract my attention when I first heard the term: Covid 19 mRNA vaccine – refer article: Covid 19 Injection.
The Book of Jubilees provides the location for Javan some time after the Flood when Japheth’s children lived in southern Central Asia, Asia Minor and Southeastern Europe.
Book of Jubilees 9:10-11
‘And for Javan came forth the fourth portion every island and the islands which are towards the border of Lud.’
This is a reference to when Javan lived throughout the Greek Islands and Lud – a son of Shem – was located in the western region of Asia Minor – Chapter II Japheth Orientalium.
Book of Jasher 7:6 and 10:13
‘And the sons of Javan were Elisha, Tarshish, Chittim and Dudonim… And the children of Javan are the Javanim who dwell in the land of Makdonia [Macedonia].’
We will study Javan, his eldest son Elishah and his youngest son Dodan in this present chapter. Javan’s middle two sons – the Kittim (or Kitti) and Tarshish – we will discuss in separate chapters.
Israel a History of – emphasis theirs:
‘The name Javan is the original form of the name Ionia. Ionia is synonymous with Greece. The same Hebrew word is translated “Javan” in some passages, and “Greece” in others. It is recognized and agreed upon by scholars that of the sons of Noah, Japheth, and his son Javan, were the initiators of the [first] Greeks. Hellas, as in Hellespont and Hellenists, is a form of the name Elishah [Javan’s firstborn son], and came to be applied to Greece as a whole.
The Tell el Amarna and Ugaritic documents, dating from the 1400’s to the 1300’s B.C., make mention of the Alasians. It appears that the Alasians were from Cyprus, yet another Greek connection to the sons of Noah and their descendants. [Dodan] are apparently the same as the Rodanim, mentioned in I Chronicles 1:7. The influence of Dodanim can be seen in the geographical names of Dardanelles, and Rhodes.’
Ancient Civilisation:
‘The name of the next grandson [of Noah], Javan, is the Hebrew word for Greece. Greece, Grecia, or Grecians appears five times in the Old Testament, and is always the Hebrew word Javan. Daniel refers to ‘the king of Grecia’ (Daniel 8:21), literally ‘the king of Javan’. Javan’s sons were Elishah, Tarshish, Kittim, and Dodanim (Genesis 10:4), all of whom have connections with the [earliest] Greek people.
The Elysians (an ancient Greek people) obviously received their name from Elishah. Tarshish or Tarsus was located in the region of Cilicia (modern Turkey). Encyclopaedia Britannica says that Kittim is the biblical name for Cyprus… Dodonaeus, possibly a reference to the fourth son of Javan… His oracle was at Dodena.’
At the time of Daniel circa 500s BCE, the Greeks mentioned are the forerunners of the Greco-Macedonian Empire which would supplant the Medo-Persian Empire – refer Chapter IV Central Asia – Madai & the Medes; and Chapter XVIII Elam & Turkey. These Greeks are a very different proposition to the original founders of the Grecian Isles and coasts following the Flood – Chapter XXVI The French & Swiss: Moab, Ammon & Haran.
The sons of Javan dispersed from the Middle East at the time of Peleg and the Tower of Babel circa 6755 BCE and into the Aegean. The later inhabitants of Greece, long after Javan’s descendants had begun their eastward arc towards the Far East and after the Minoans and Mycenaeans had arrived beginning circa 3500 BCE; began populating Greece from circa 1700 BCE – please refer to point number two in the introduction (primus verba).
The Races of the Old Testament, A H Sayce, 1891, pages 46-47:
‘Cyprus was called the island of the lonians by the Assyrians… Tarshish is usually identified with Tartessos in Spain, not far from the modern Gibraltar. It was the furthest point reached in the western basin of the Mediterranean by the Phoenician and Greek traders. The ships which made the voyage were consequently known as the ships which traded to Tarshish, or more briefly, ships of Tarshish. The phrase gradually came to be applied to any kind of merchant vessel, even to those which had never visited Tarshish at all. Kittim was Kition in Cyprus… It was, however, a Phoenician and not a Greek settlement… Dodanim, on the other hand, may represent a Greek colony…. Rodanim is an alternative reading of Dodanim… In this case, it will denote the natives of the island of Rhodes.’

The sons of Javan as the original ‘Greeks’ founded civilisations on the islands of Cyprus, Crete, Rhodes, Malta, Sicily and beyond; all the way to Spain and its islands and coastal regions. Considerably later, the Phoenicians, also a maritime people, descended from Shem; re-occupied many of the isles and inlets located in the Mediterranean Sea – refer Chapter XXIII Aram & Tyre: Spain, Portugal & Brazil; and Chapter XXVII Abraham & Keturah – Benelux & Scandinavia.
The Origin of the Nations, Herman Hoeh, 1957 – capitalisation his, emphasis mine:
‘… where are the Greeks, South Italians, Spaniards and Portuguese mentioned in prophecy? Turn to Genesis 10:2, 4. Here is the answer. You find Javan, a son of Japheth, listed. Javan had four sons… In I Chronicles 1:7 the last name is spelled Rodanim. The Bible itself proves how often names were changing [?] in ancient times. Where are the sons of Javan today? The Bible makes the answer very plain. No need to look for any evidence outside of the Bible this time.
Look in either STRONG’s or YOUNG’s CONCORDANCE. There you will find that in the Old Testament, wherever the words “Greece” or “Grecia” are used in English, the word “Javan” is used in Hebrew! Javan is the father of the Greeks, and of the other Latins. His son Elishah spread into “Hellas” – the Greek Isles in the Aegaean Sea and to Cyprus, anciently called “Alisha”. His son Dodanim or Rodanim spread through the Dodecanes, and the Isle of Rhodes and parts of the French Mediterranean coast along the Rhone.’
It is a common assumption to interpret Javan as the Latins of Italy and the Iberian peninsula – due to the apparent Javan Greek to Greece connection. Remembering points one and two in the introduction (primus verba), the original sons of Javan from Japheth travelled throughout the Mediterranean leaving their presence behind them through the naming of their cities.
Migrating peoples descended from Shem, followed and settled. They may have assumed the original names, for instance ‘Greece’, though todays Greeks are not the sons of Javan, nor are they the remnants of the mighty Greco-Macedonian Empire, as we shall learn – Chapter XXVI The French & Swiss: Moab, Ammon & Haran. As the constant reader will already realise or is beginning to see, it is inaccurate to assume otherwise merely based on place names and appellations for past civilisations.
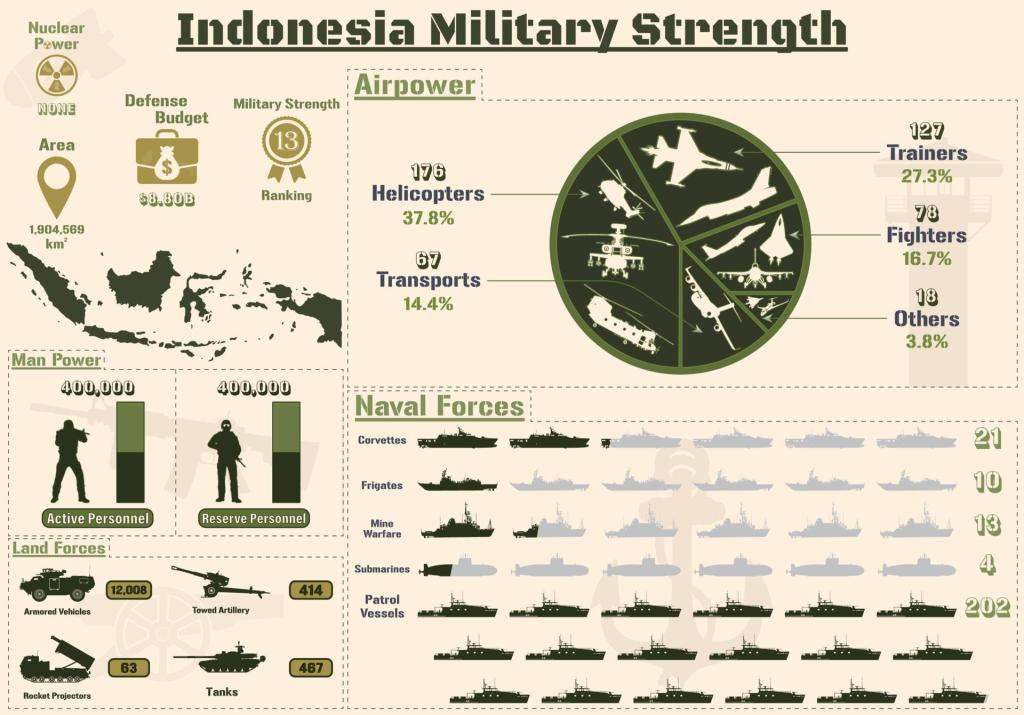
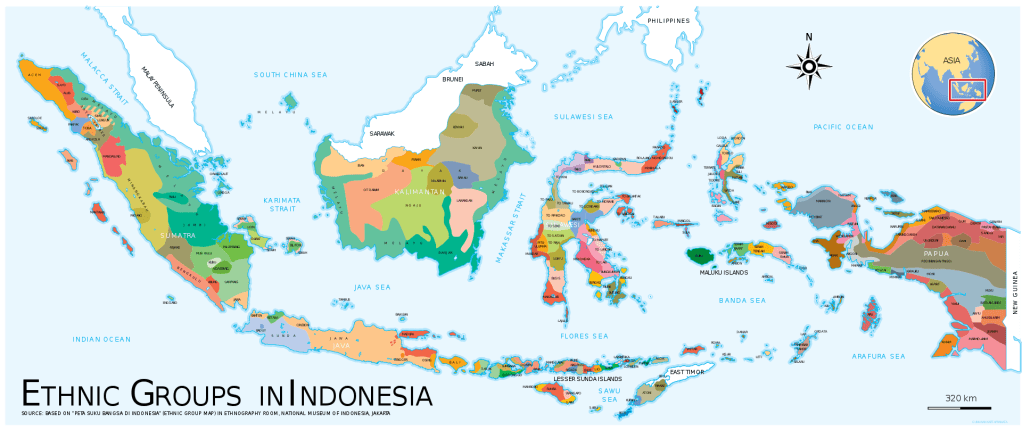
Javan in Hebrew means: ‘mire’ from the noun yawen and is translated as Ionia, Grecia or Greece. It has a similar meaning to the root word H3196, effervescing, as in hot and active, like the amazing four hundred Volcanoes in Indonesia, of which one hundred and thirty are active.
In Persian, Javan means ‘young.’

Abarim Publications:
‘The name Javan comes from yawen… which is wet [swampy, boggy ground] or soft mud and represents the transitional state between water… and dry land… water (seas and rivers) denote liquidity, growth and potential… in the Bible the great cultures are always associated with their respective great rivers. For a meaning of the name Javan, Jones’ Dictionary of Old Testament Proper Names reads Supple, Clay. NOBSE Study Bible Name List simply reads Greece.’
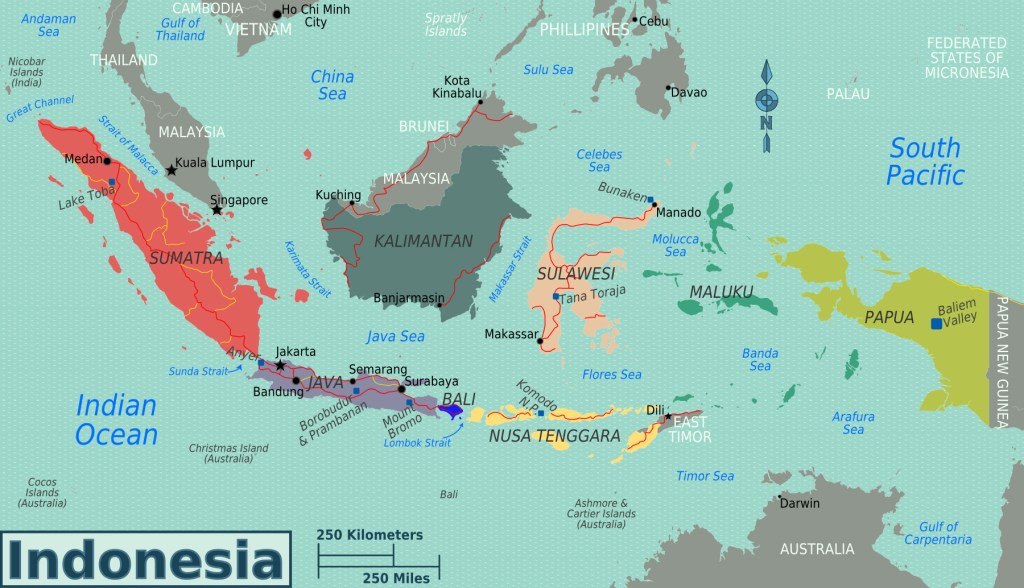
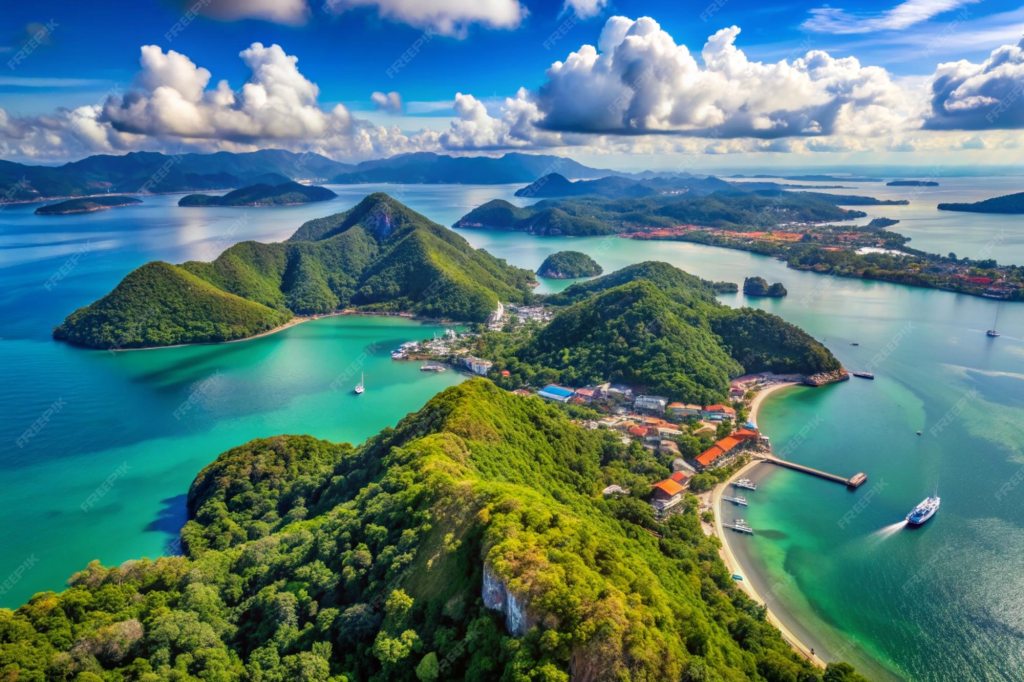
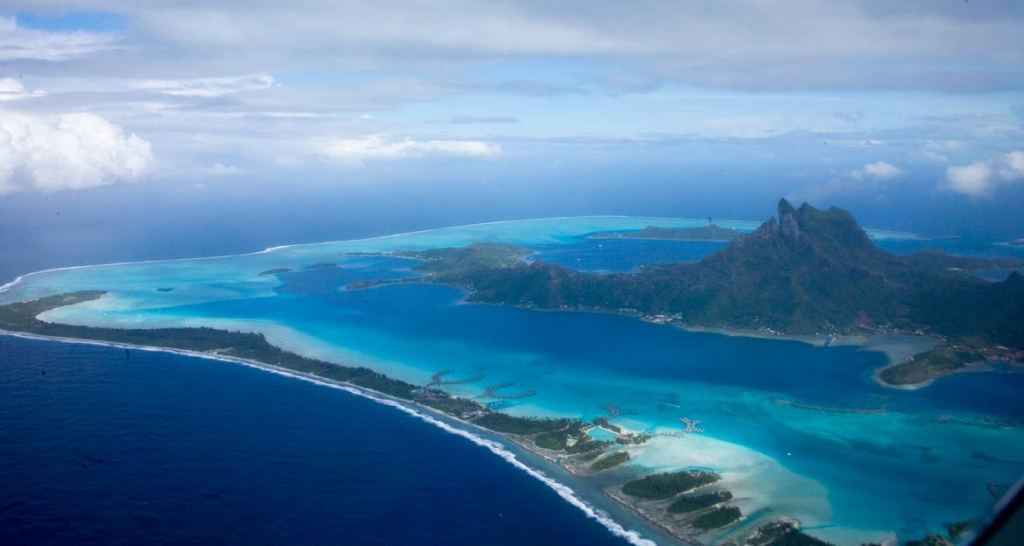
An appropriate name when considering Javan’s relationship with water and where his sons are dwelling today. The descendants of Javan are located adjacent to their cousins from Gomer, in the principal archipelago nations of South East Asia – Malaysia (Singapore), the Philippines and the Pacific Islands… as well as Indonesia, to be discussed in the next chapter, followed by Tarshish .
Elishah in Hebrew means: ‘God supports’, ‘God is my salvation’, also ‘to set upright, to stand.’ Abarim Publications adds that the verb, sasha means ‘to be unrestricted’ and thus to be free, to be saved from oppression and ultimate demise. The adjective shoa means: ‘(financially) independent’ or ‘freed in an economic sense’.
This definition is indicative of modern Malaysia.
Ezekiel 27:7
New English Translation
‘Fine linen from Egypt, woven with patterns, was used for your sail to serve as your banner; blue and purple from the coastlands of Elishah were used for your deck’s awning.’
Footnote:
‘This is probably a reference to Cyprus.’
The word translated as coastlands is H339 ‘iy meaning: ‘coast, island, shore, region’ and ‘a desirable, habitable spot’. Translated in the KJV as mainly isles, 30 times; or islands, five. Many translations translate Elishah as Cyprus, which can also mean Kitti the third born son of Javan. This is a fascinating connection as Elishah and Kitti both lived on Cyprus, before it became associated mainly with the Kittim – refer Chapter VIII Kittim & Indonesia.
Just as the island of Cyprus is split into a Turkish northern third and a Greek southern two-thirds today. Kitti works as a reliable alternative identity, for the simple reason they too, are a maritime nation sharing territory with Elishah. Anciently, Elishah lived on Cyprus as well as the Grecian mainland.
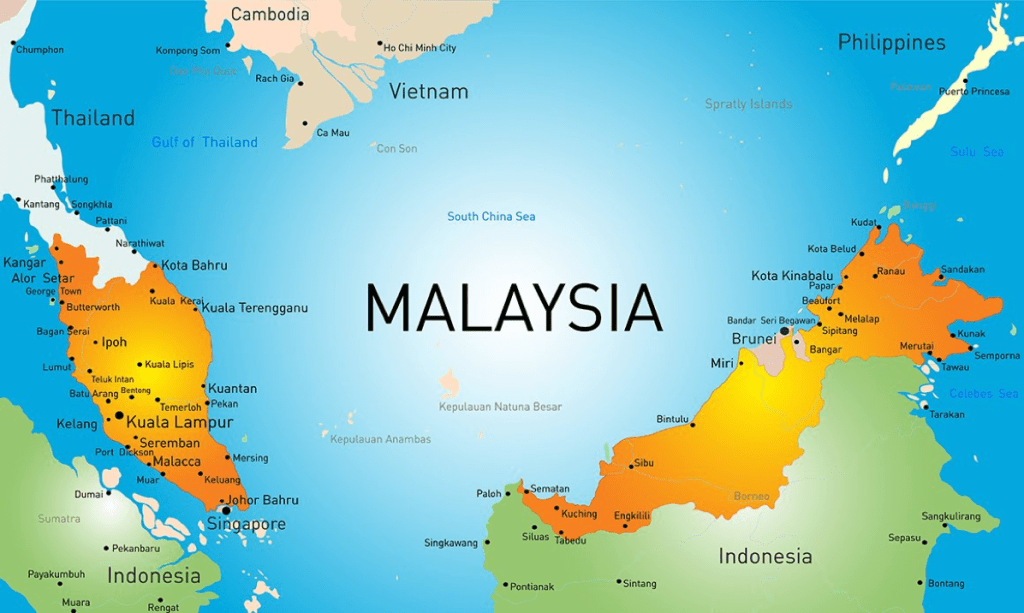
Today, Malaysia is the only nation descended from Javan which is not entirely comprised of islands. It is divided as West Malaysia on the peninsula shared with Thailand and East Malaysia on the island of Borneo – the world’s third largest island – shared with Indonesia.

Flag of Malaysia
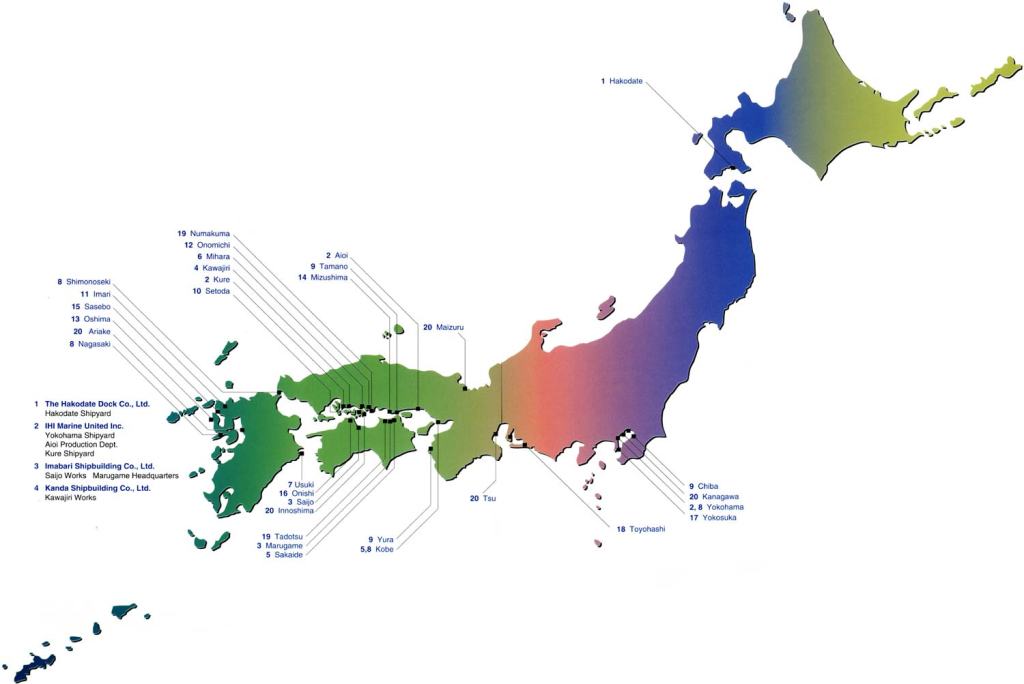
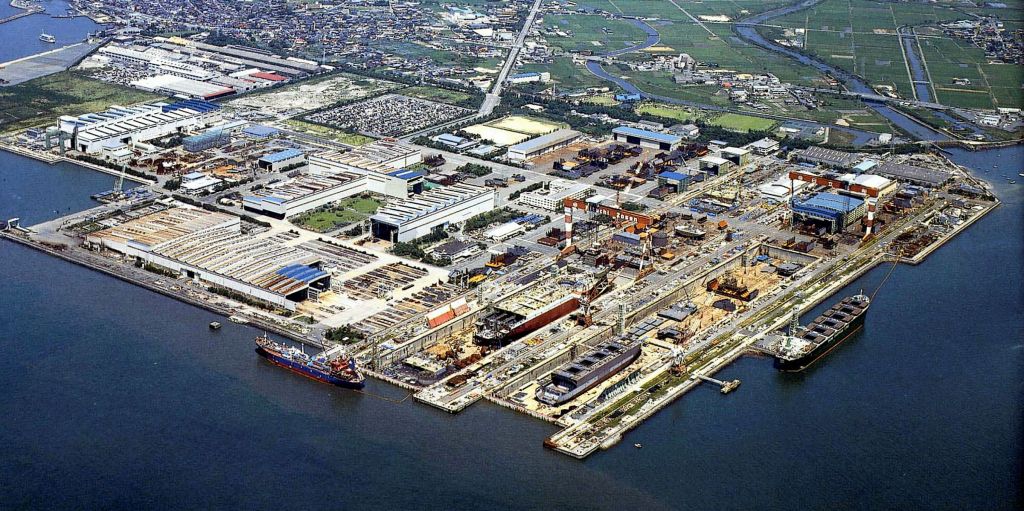
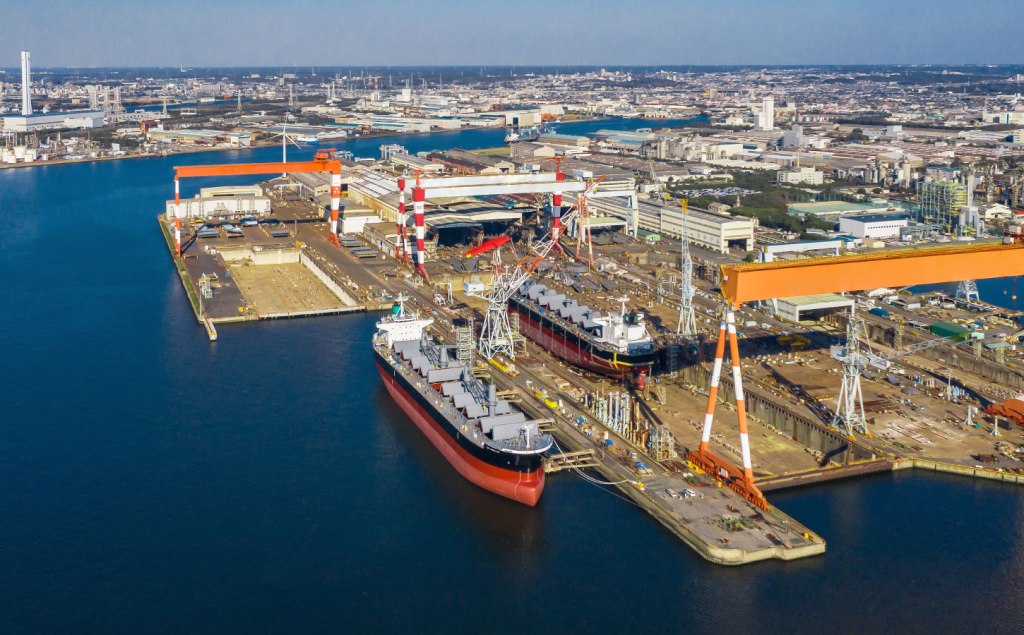
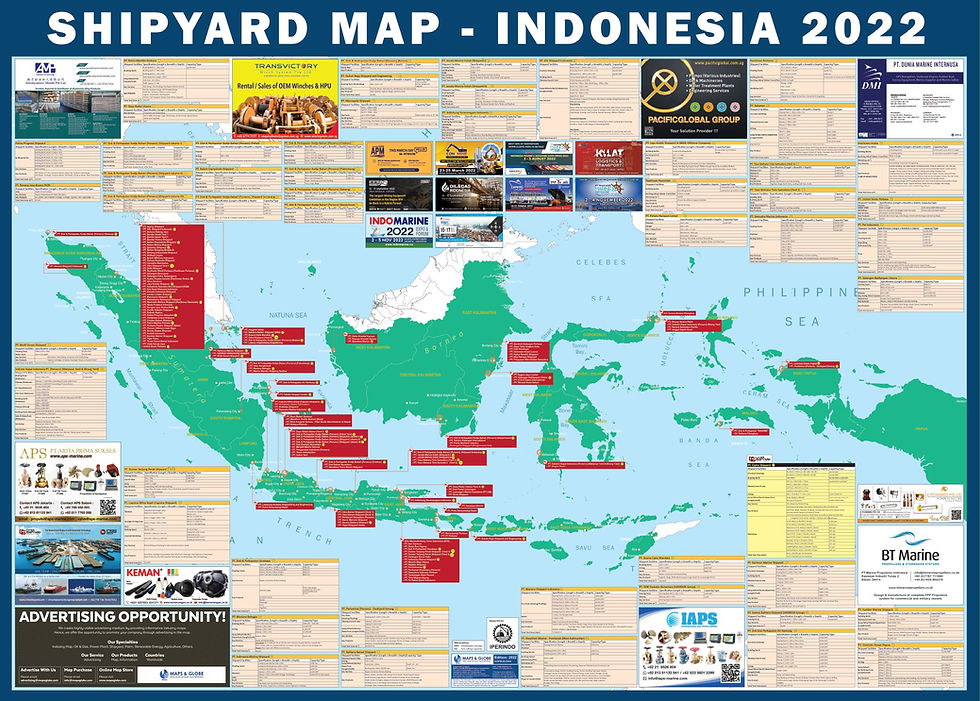
Malaysia has a long history of maritime activities, whether it be trade via shipping, its practical location for ports, or its many shipyards. Located In the Malay Peninsula, the first inhabitants were Negritos – refer Chapter XIII India & Pakistan: Cush & Phut.

Traders and settlers from India and China arrived as early as the first century CE and established ports and coastal towns in the second and third centuries. Between the seventh and thirteenth centuries, most of the southern Malay Peninsula was part of the maritime Srivijayan Empire. In the early fifteenth century, Parameswara, a runaway king of the former Kingdom of Singapura, linked to the old Srivijayan court, founded the Malacca Sultanate. Malacca became a major Islamic centre and an important commercial hub in attracting trade from all around the region – particularly between China and India.
Malacca was conquered by Portugal in 1511, after which it was controlled by the Dutch from 1641. The significance of the Portuguese and Dutch invariably being the first Europeans to navigate the world’s oceans, while establishing trading posts (or colonies) will become remarkably clear as we progress – for they are each the embodiment of the original Phoenicians from Tyre and Sidon respectively (Chapter XXIII Aram & Tyre: Spain, Portugal & Brazil; and Chapter XXVII Abraham & Keturah – Benelux & Scandinavia).
In 1786, the British Empire established a presence in Malaya, when the Sultan of Kedah leased Penang Island to the British East India Company. The British later acquired the town of Singapore in 1819 and in 1824 took control of Malacca following the Anglo-Dutch Treaty. By 1826 the British controlled Penang, Malacca and Singapore. Under British rule, the immigration of Chinese and Indians to serve as labourers was encouraged.
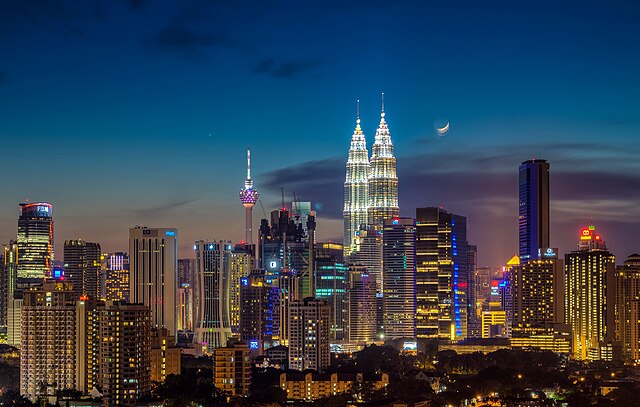
Capital of Malaysia – Kuala Lumpur
Peninsular Malaysia was unified as the Malayan Union in 1946 and restructured as the Federation of Malaya in 1948, achieving independence in 1957. Malaya united with North Borneo, Sarawak and Singapore in 1963 to become Malaysia – though in 1965, Singapore was expelled from the federation.
Over half the population of Malaysia is ethnically Malay with the additional minorities including Chinese, Indians and indigenous peoples. The population of Malaysia is 36,184,495 people.
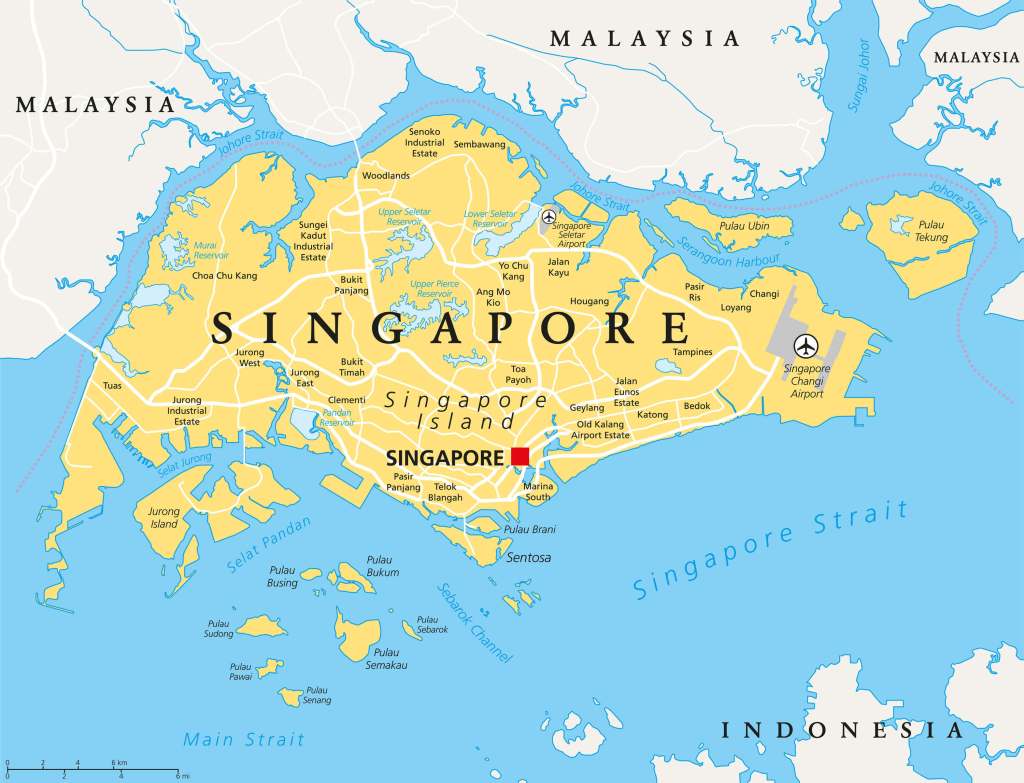
The Malays account for 13% of the total population in Singapore which comprises 5,889,544 people.
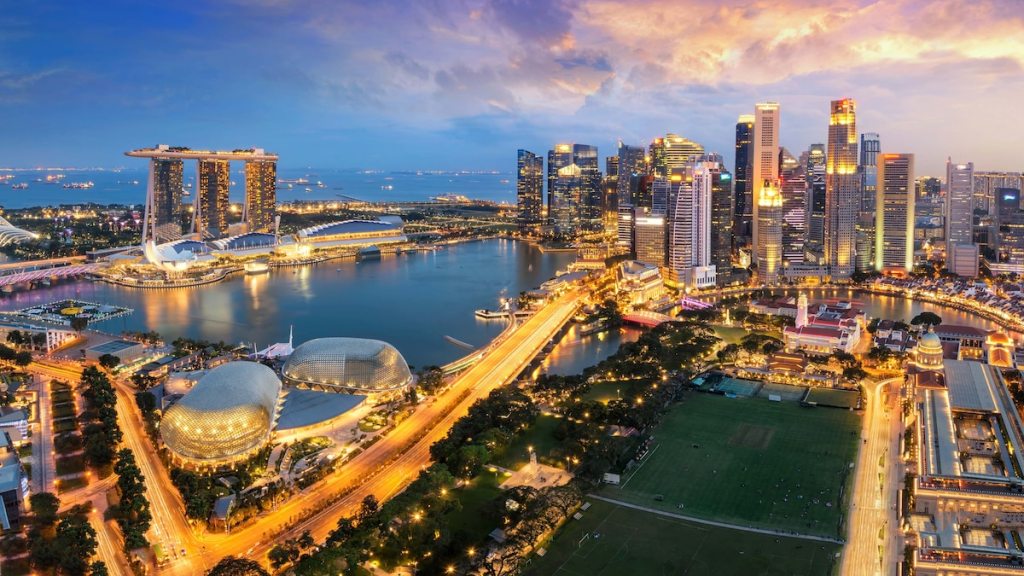
Singapore City
The mtDNA Haplogroup E, is found throughout Maritime Southeast Asia, though in small amounts – 2% in Malaysia (including Sabah of Borneo). It has been detected in populations of the Philippines, Indonesia, as well as in Taiwan.
Haplogroup E is nearly absent from mainland East Asia. Even though Taiwan is predominantly Han Chinese, there is a residue of Haplogroup E due to the Malay-Polynesian (Austronesian) peoples originally entering Taiwan from the Chinese mainland.

Malayan men

The principle mtDNA Haplogroups for Malayans include Ma* with 39.1%; F1a, 16.7% – the main branch of F in Southeast Asia – and B5, 10.8%. Other lesser key Haplogroups for the Malays include: M21a, 5.9%; B4, 7.8%; N9a, 2.9% and R, 7.8%.
Recall, Haplogroup B is of particular interest for it reveals a common maternal ancestral tie between South East Asia (Gomer, B4), Central Asia (Madai) and the Native Indians of the Americas (Tiras, B2). While B4 is the prevailing bough in Haplogroup B, it is B5 which is most frequent in North East Asia – and in this case for Malays.
The letter a, ‘includes all variations of the M super Haplogroup that are not specified’, such as M7 frequent in South East Asia and the descendants of Gomer – Chapter V Gomer: Continental South East Asia.

Malayan women

Dodan in Hebrew means:
‘Leaders’ from the verb dada, ‘to move or lead slowly.’
Abarim Publications – emphasis mine:
‘In the parallel text of 1 Chronicles 1:7, the Dodanim are called Rodanim. Some scholars believe that the Chronicler made an error and read a Hebrew (resh) for the somewhat similar daleth – which would be comparable to a professional writer today speaking of Oatar instead of Qatar; rather unlikely, and threw an additional waw in for good measure. Another possibility is that the Dodanim of old were known as Rodanim in the Chronicler’s days. It’s even possible that by speaking of Rodanim, the Chronicler indicates that his text is not a copy of but rather a commentary on the established text…
The name Dodanim appears to be a plural form of a name similar to Dedan, and is closely similar to the name [Dedan]. The Dedanim, however, are either descendants of Japheth’s brother Ham (Genesis 10:7) or else Jokshan, a son of Abraham and a distant descendant of Japheth’s other brother Shem (Genesis 25:3).’

Mayon Volcano on the island of Luzon
Two men named Dedan are mentioned in the Bible: one a grandson of Cush, the son of Ham and the other a grandson of Abraham, descended from Shem. Two different Dedans, though commentators have erroneously tried to equate them as one and the same person, or biblical identity. Dodan’s name is very similar, though he is a separate person, resulting in a total of three people – two Dedans and one Dodan.
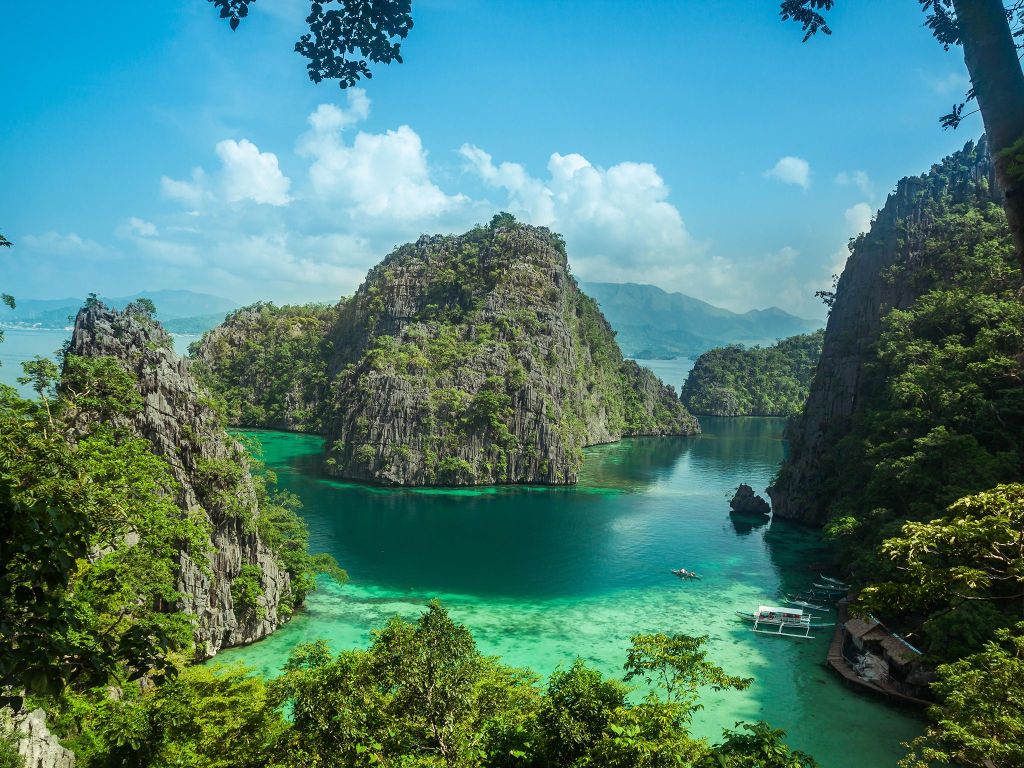
Palawan
Abarim:
‘It’s not immediately clear where the name Dodanim may have come from, but to a Hebrew audience it would have looked related to the following root group: The root (yadad) has to do with love… in the affectionate, physical sense. Adjective (yadid) means beloved or lovely… an identical verb (yadad II) means to cast a lot… originally meant to cast but which evolved to praise… our root has to do with physical fondling… [and]… to move slowly.’
The Filipinos – resulting from a process of elimination and linked relatedness – represent the descendants of Dodan today. The writing of Dodan in the plural as Dodanim in the Bible may be a clue pointing to the diversity of the Filipino people over such a large volume of island territory. The same may hold true of the Rodanim and Kittim. We will see this scenario repeated with Ham’s son Mizra, recorded as Mizraim.
Flag of the Philippines
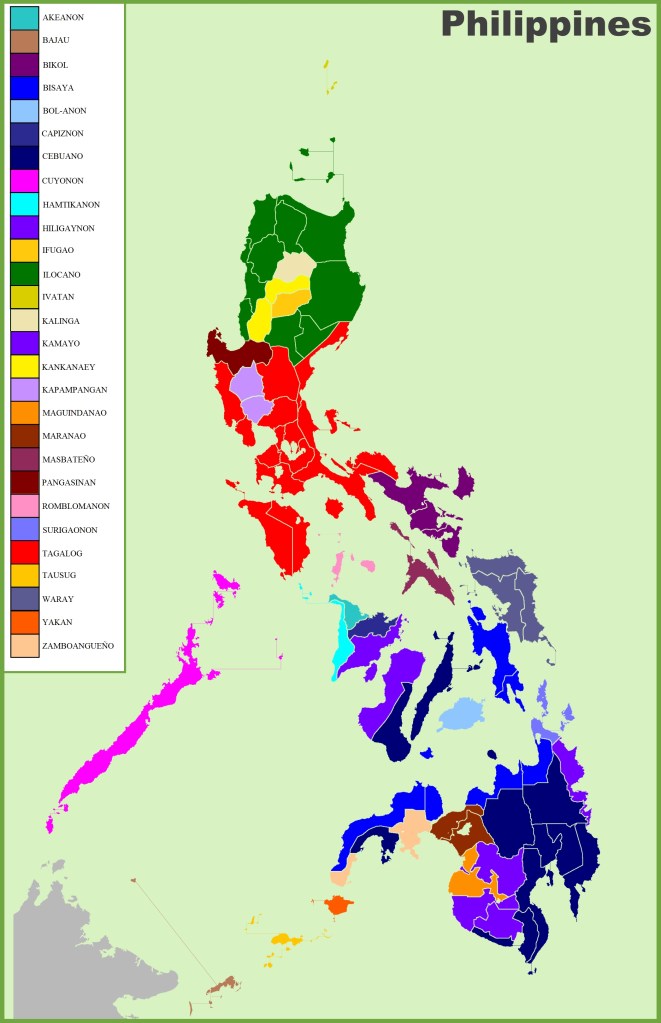
The Republic of the Philippines consists incredibly, of approximately 7,641 islands which are categorised under three main geographical divisions from north to south: Luzon, Visayas and Mindanao. The capital city is Manilla and the most populous city is Quezon City, both within the single urban area of Metro Manilla situated on the island of Luzon.

Manilla
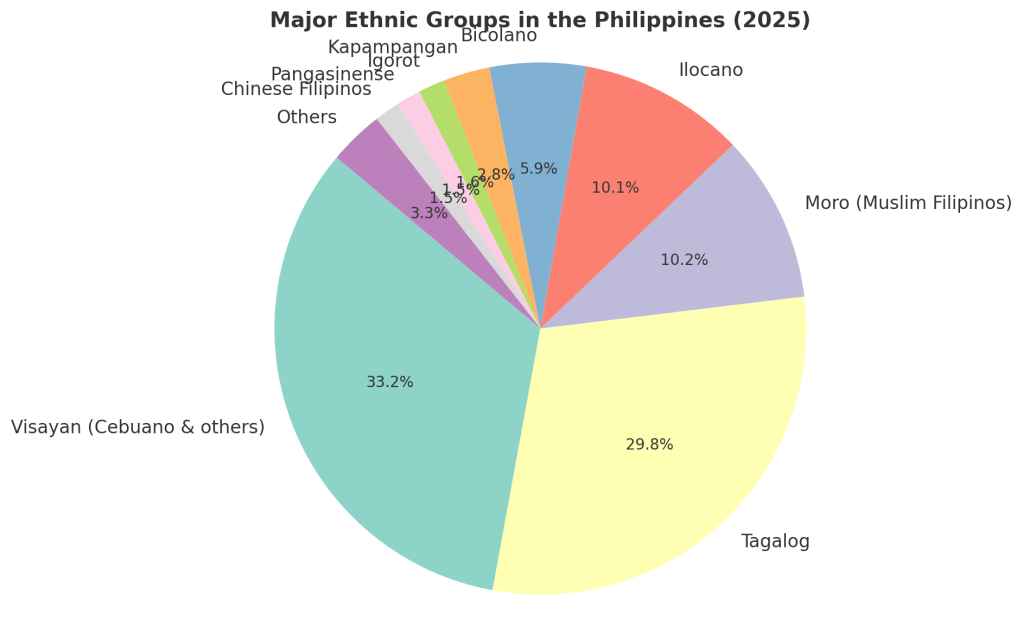
The Philippines has a population of 117,249,747 people – the 14th most populated country in the world. Multiple ethnicities and cultures are found throughout the islands, with Negritos (Melanesians), some of the archipelago’s earliest inhabitants followed by successive waves of Austronesian peoples of Malay-Polynesian descent.

In 1521, Portuguese explorer Ferdinand Magellan arrived and claimed the islands for Spain. In 1543, Spanish explorer Ruy Lopez de Villalobos named the archipelago Las Islas Filipinas in honor of Philip II of Spain. Colonisation began in earnest when Spanish explorer Miguel Lopez de Legazpi arrived from Mexico in 1565. In 1571, Spanish Manilla became the capital of the Spanish East Indies which encompassed Spanish territories in Asia and the Pacific.
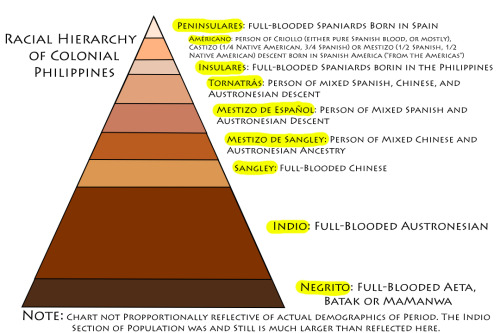
The Spanish considered their war with the Muslims in Southeast Asia an extension of the Reconquista. From 1565 to 1821 the Philippines were governed as part of the Mexico based Viceroyalty of new Spain. Later it was administered from Madrid following the Mexican War of Independence. Manilla was the western hub of trans-Pacific trade and Catholicism became the dominant religion – after Islam had originally gained a foothold.
In 1896 the Philippine Revolution began, which then became entwined with the 1898 Spanish-American War. Spain ceded the territory to the United States and Filipino rebels declared the First Philippine Republic.
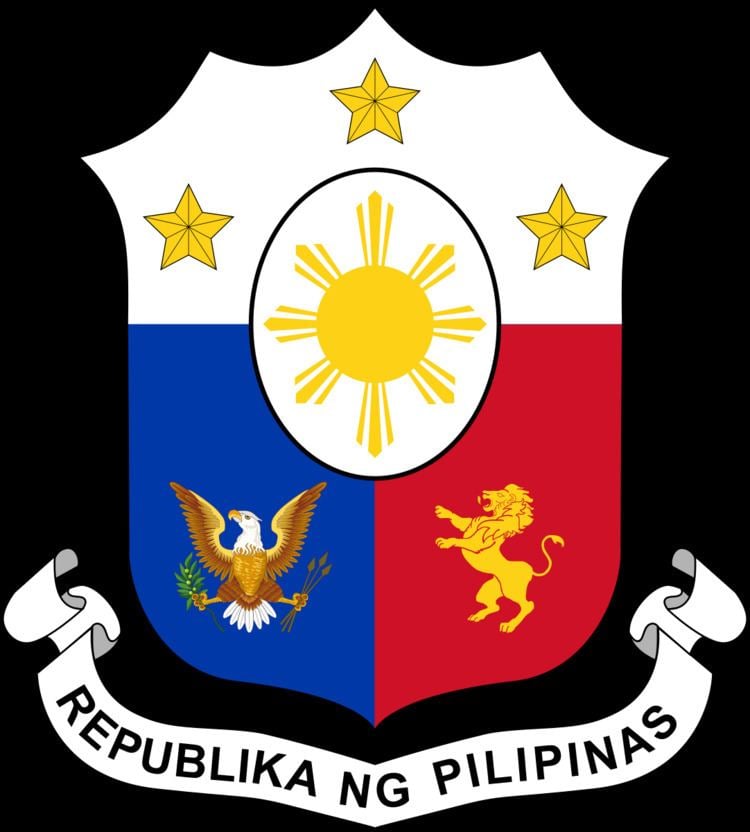
The Philippine Coat of Arms – note the presence of an American Eagle in the lower left quarter of the shield
The ensuing Philippine-American War ended with the United States establishing control over the territory, maintained until the Japanese invasion of the islands during World War II. The Philippines gained independence shortly thereafter in 1946.

Filipino men

Oxford Business Group – emphasis mine:
‘Over the last 50 years, the Philippines has grown to become a leading provider of maritime professionals and is subsequently considered by many to be the seafaring capital of the world. At present there are over 10.5m Filipinos living and working abroad, and in 2013 they sent total remittances of around $23 [billion] back home to the Philippines. The maritime industry is a major contributor to this: nearly 400,000 Filipino seafarers were working overseas in 2013, contributing a total of more than $5.2 [billion] in remittances. “Seafaring is the Philippines’ biggest strength, currently supplying roughly 30% of the world’s seafarers, which is miles away from the second-largest source country.”

Pommie Travels, Victoria Brewood – emphasis mine:
‘Asia is the last place you’d expect to find an English-speaking nation. A lengthy occupation by the United States introduced Filipinos to English.
Today, most Filipinos [5th biggest English speaking nation in the world] speak the world’s most-spoken language… Filipino culture – it stands out noticeably from the rest of Asia. Thanks to 500 years of Spanish and American colonization, you could be forgiven for thinking you’ve arrived in Latin America rather than Asia.’

Filipino women

The Philippines had a GDP in 2025 of $497.5 billion. The 33rd biggest economy in the world; closely followed by Malaysia with the 37th biggest economy and a GDP of $444.98 billion.
The main export of both the Philippines (50.3% of total exports) and Malaysia (36.8% of total exports) was comprised of electrical machinery and equipment.
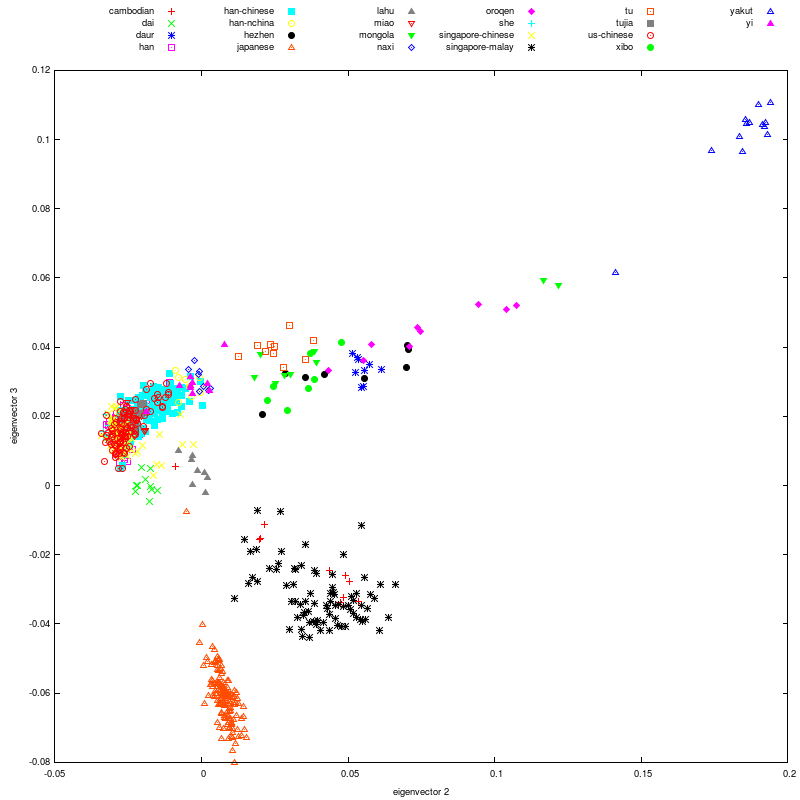
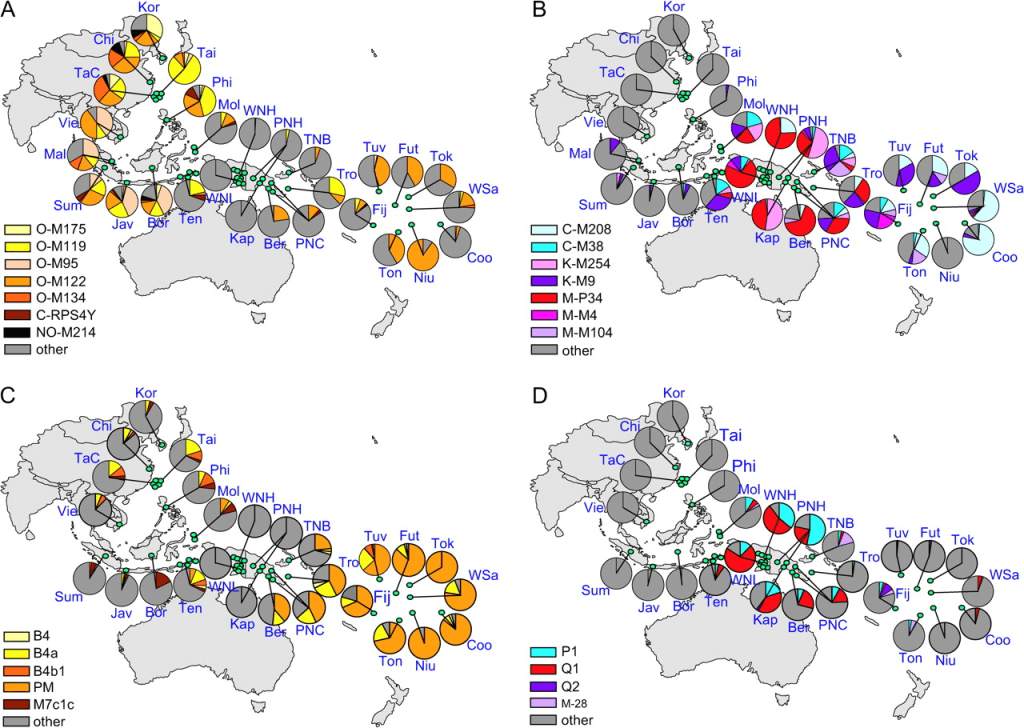
Philippine Mitochondrial DNA Diversity: A Populated Viaduct between Taiwan and Indonesia? Multiple Authors, 2010 – emphasis & bold mine:
‘Comparison of the mtDNA haplogroup frequency distributions in the three major island groups of the Philippines showed similar haplogroup profiles. Southeast Asian populations cluster closely together in an MDS plot including groups from Near Oceania and Polynesia. However, an MDS plot of Asians and Southeast Asians reveals genetic differentiation between these groups.’

‘Plot of first two dimensions produced by MDS analysis of mtDNA haplogroup frequencies in selected East, Southeast Asian, Near Oceanic, and Polynesian populations, including Borneo (BOR), Hakka (HAK), Hlai (HLA), Java (JAV), Maluku (MAL), Nusa Tenggara – Austronesian (NTA), Northern Han (NOH), Philippines (PHL), Southern Han (SOH), Sulawesi (SLW), Sumatra (SUM), Taiwanese Aborigines (TAB), Thailand (THL) and Vietnam (VTN).
(A) Including Nusa Tenggara – Non-Austronesian (NTN), Polynesian (POL), and West Papuan (WEP); Borneo and Sumatra overlap.
(B) East Asian and Southeast Asian groups only.’
‘The Philippines, Taiwanese Aborigines, and Sulawesi cannot be clearly separated in the first dimension of the MDS plot; these groups can only be distinguished in the second dimension. However, the MDS plot does enable us to differentiate between the latter populations and other Island Southeast Asians (Maluku, Java, Borneo, Sumatra, and Austronesian-speaking groups in the Nusa Tenggaras).
Han Chinese populations from Taiwan (Hakka) and southern China group closely together, whereas mainland Southeast Asian populations from Vietnam and Thailand are interspersed with other East Asian groups.
Genetic distances between these populations are most closely correlated with the distributions of haplogroups B5b, M7b3, and M7c3c (r ≥ 0.25); less so with other frequent haplogroups such as E1a1a and B4a1a. Lineages that comprise a significant proportion (≥5%) of the Philippine population and are generally shared with both Island and/or Mainland Southeast Asians include B4b1, B4c1b, B5b, E, and R9c. Among these mtDNA lineages, haplogroup E is unusual in that it is virtually absent in mainland Asia.’
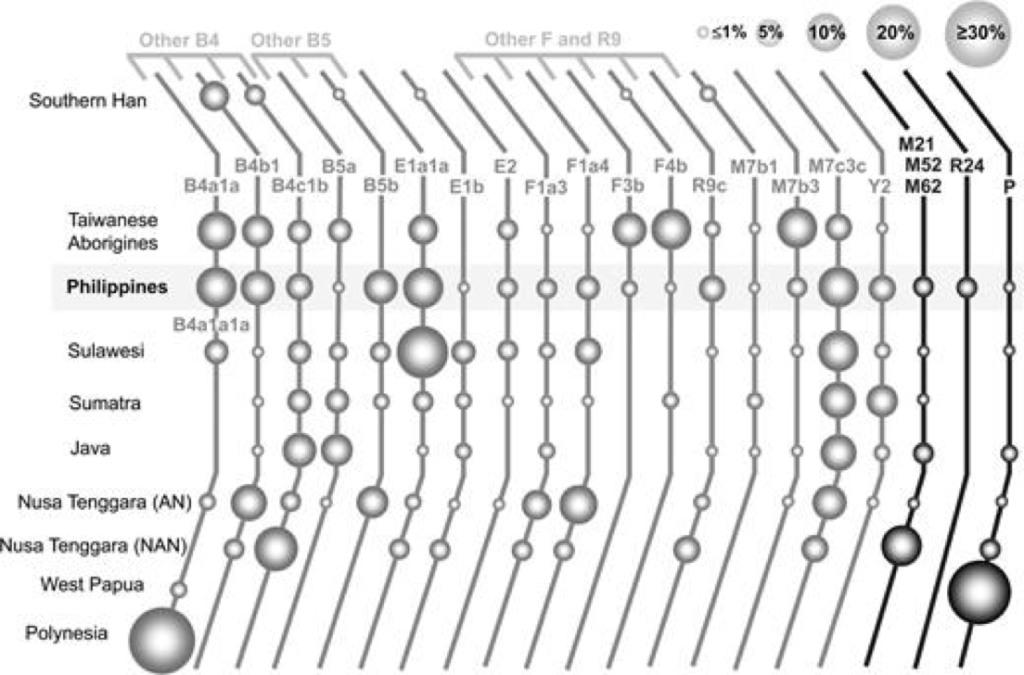
Frequencies of major mtDNA haplogroups in East Asian, Southeast Asian, Papuan, and Polynesian groups
‘Haplogroup B4a1a is highly diverse in Taiwan, but the subclade (B4a1a1) characterized by a mutation at np 14,022 is absent there. The identification of haplogroup B4a1a1 in the Philippines may indicate a stage of development of the Polynesian Motif along the north to south pathway proposed in the general Out of Taiwan model for the Austronesian population expansion.
This apparently completes a series of genetic links from Taiwan (where the B4a1a motif may have originated), through the Philippines (where the np 14,022 mutation might have evolved) and finally to Indonesia (where the full Polynesian Motif first occurs).
However, the observation of a B4a1a1 sample in the Philippine population is not necessarily incompatible with models that argue for an extended development period for the Polynesian Motif in ISEA, if the proposed area of development of the motif is expanded to include the Philippines. Another alternative explanation is that the B4a1a1 lineages might have been brought to the Philippines by a back migration from Indonesia.’
The cluster of island Southeast Asia and Polynesia mtDNA maternal Haplogroups, confirms the genetic link between Polynesia with the rest of southeast of Asia. The article also supports that migration from Taiwan to Indonesia and Polynesia went via the Philippine Islands.
The most common Filipino Haplogroups include:
M7c, 17.8%; B4a, 10.8%; E1a, 9.4%; B5b, 7.5%; Y2a1 5.6% and F1a, 4.7%.
Maternal mtDNA Haplogroups which the Filipinos possess in common with Taiwan and indicative of the Austronesian expansion include: B4a1a1a, E1a1a, M7b3, M7c3c, and Y2. All of these are almost completely non-existent in Thailand, showing first, that the Austronesian expansion from Taiwan did not include the South East Asian mainland and second, the precise ethnic dividing line existing between Gomer’s offspring and Javan’s descendants.
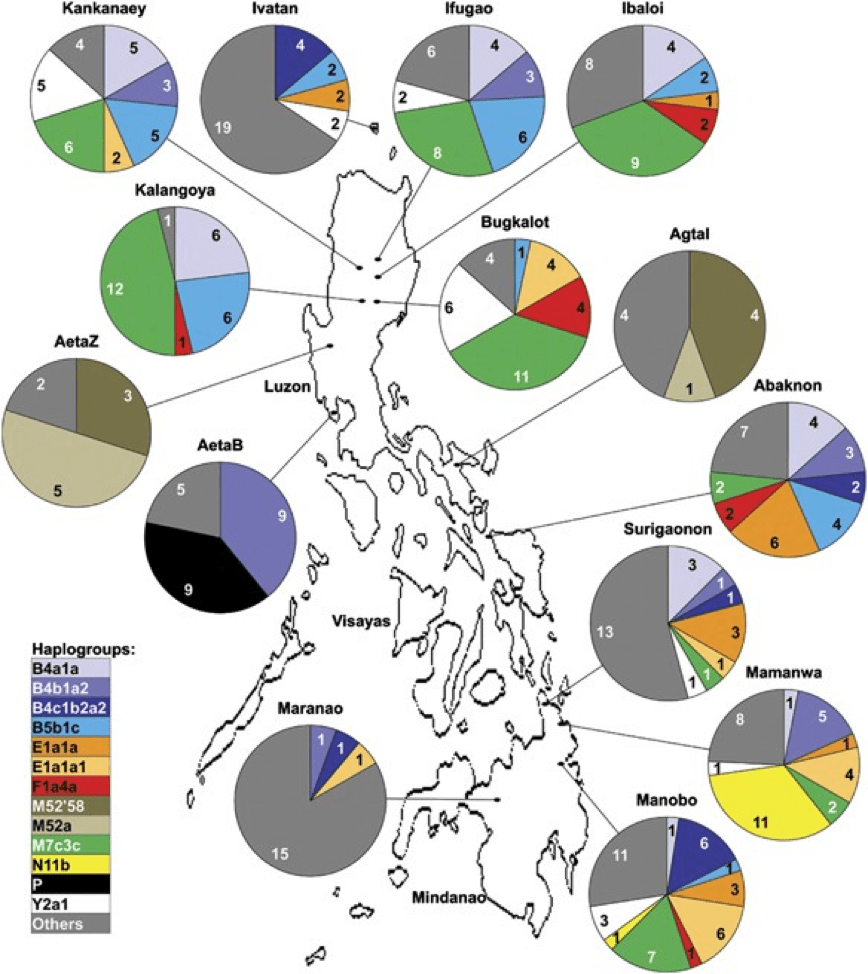
Complete mtDNA Genomes of Filipino Ethnolinguistic Groups: a melting pot of recent and ancient lineages in the Asia-Pacific region, Multiple Authors, 2013 – emphasis mine:
‘The Philippines is a strategic point in the Asia-Pacific region for the study of human diversity, history and origins, as it is a cross-road for human migrations and consequently exhibits enormous ethnolinguistic diversity. Although some mtDNA haplogroups can be associated with the Austronesian expansion, there are others that associate with South Asia, Near Oceania and Australia that are consistent with a southern migration route for ethnolinguistic group ancestors into the Asia-Pacific, with a timeline that overlaps with the initial colonization of the Asia-Pacific region, the initial colonization of the Philippines and a possible separate post-colonization migration into the Philippine archipelago.
Haplogroups B4b1a and B5b1c are of appreciable frequency (> 5%) in [Filipino Ethnolinguistic] groups. However, population comparison was limited to FE groups and Japan because Japan was the only population-based and geographically defined group in the reference data set that possessed B4b1 and B5b1 lineages. FE group and Japanese B4b1a and B5b1 coding sequences fall into distinct clades that diverged some 15-20 kya… suggesting an ancient link.
But as macrohaplogroups B4 and B5 and their sublineages are generally associated with mainland East and Southeast Asia, more population-based samples of complete mtDNA genomes from these regions are required in order to verify the observed Filipino-Japanese association.’
This is a telling paragraph regarding the genetic link between the Filipinos and Japanese – refer Chapter IX Tarshish & Japan. It is as revealing and vital as the link we investigated and established between Gomer’s sons Ashkenaz of Vietnam and Togarmah of the Koreas.
The article admits mtDNA Haplogroup B is associated with East Asia (B5) and South East Asia (B4*) and so questions its frequency in the archipelago nations. Yet as we have observed in preceding chapters, Haplogroup B is a common denominator throughout the descendants of Japheth studied thus far – Tiras (B2), Madai and Gomer.*

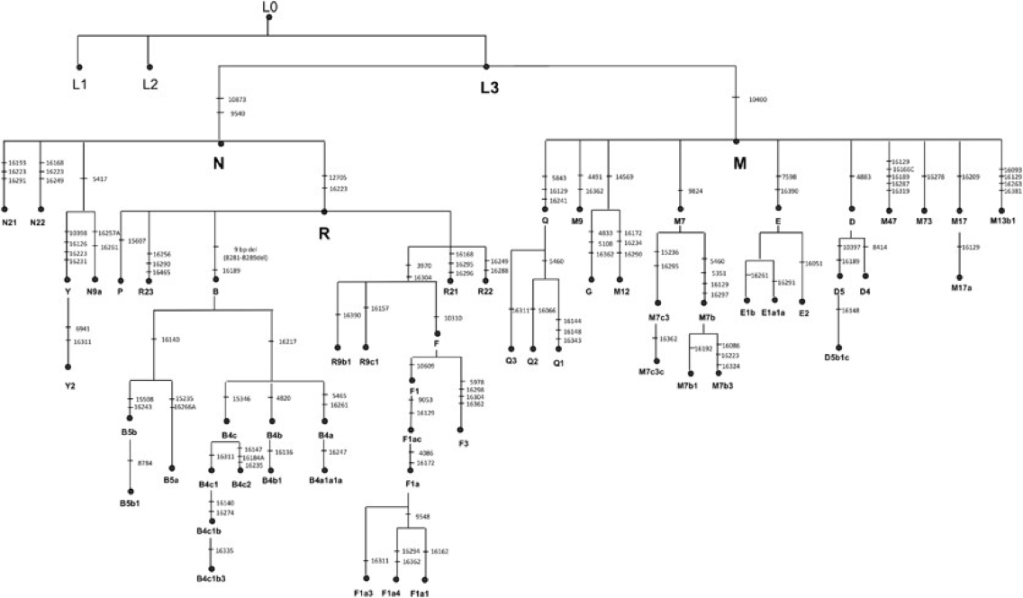
Though Haplogroup B – with F – is a relatively recent mutation as viewed above, it follows a lineage from the super haplogroups R to N and L3. The question arises as to how half of Japheth’s descendants carry A, B, F and Y mutations inherited from the maternal ancestor represented by N; while also possessing Haplogroups C, D, E, G and Z from another maternal ancestor, M.
A solution which runs counter to the conclusion reached by scientists, yet remains the only plausible answer is that Haplogroup M mutated from L3 and N actually follows M rather than L3.
‘In conclusion, this study has demonstrated various features of the mtDNA landscape of the Philippines… mtDNA showed that the Filipino population is heterogeneous and composed of diverse FE groups and Regional Centres groups, with no simple dichotomy between FENegrito and FEnon-Negrito groups… there… could [be] different demographic histories for the Filipino Ethnolinguistic groups included in the study… FE groups have genetic affinities primarily with northern East Asia and Southeast Asia…’
The most frequently occurring paternal Y-DNA Haplogroups among modern Filipinos are Haplogroup O-M119 (O1a) and Haplogroup O-M122 (O2), which are found with high frequency in many populations from East Asia, Southeast Asia, and Polynesia.^
Haplogroup O-M119 is shared especially with Taiwan, Western Indonesia and Madagascar.^ Filipinos unsurprisingly, also possess O-M268 (O1b) the remaining most prevalent male Haplogroup in Eastern Asia.

The prime Y-DNA Haplogroups for Malays and Filipinos.
Malaysia: O1b [32%] – O2a [30%] – O1a [8%] – K [8%] –
C [6%] – F [6%] – [R1a – D1 – H]
Philippines: O2a [39%] – O1a [28%] – K [20%] –
C [5%] – O1b [3%]

The Malays and Filipinos share five main key Haplogroups and are clearly related; yet as siblings, they could not be more different. In Malaysia there are Haplogroups belying the Indian element of the demographic with R1a and H. Unlike Vietnam with virtually no Haplogroup K, Malaysian men do carry it and Filipino men possess a full fifth of their population with the major interconnecting Haplogroup.
Fascinatingly, Malays and Filipinos are completely opposite in O1a and O1b frequency levels and only partially similar in O2. In fact, the high percentage for Haplogroups O1a and K is unique throughout East Asia. Overall, the Philippines stand out as distinct from Malay males, who with an equivalent high percentage of O1b share a more similar sequence with Vietnam and the Koreas.
Vietnam: O2a [40%] – O1b [32.9%] – Q [7.1%] – O1a [5.7%] –
C [4.3%] – D1 [2.9%] – N [2.9%] – J2 [2.9%]
Korea: O2a [42.1%] – O1b [ 33.1%] – C [12.9%] – N [3.8%] –
O1a [3.1%] – D1 [ 2.5%] – Q [1.8%] – K [0.5%]
Comparing the key Y-DNA East Asian and Southeast Asian Haplogroups of C, K and O highlights the following.
Malaysia: O1b [32%] O2a [30%] O1a [8%] K [8%] C [6%]
Philippines: O1b [3%] O2a [39%] O1a [28%] K [20%] C [5%]
Vietnam: O1b [33%] O2a [40%] O1a [6%] C [4%]
Korea: O1b [33%] O2a [42%] O1a [3%] K [0.5%] C [13%]
The Malays, Filipinos, Vietnamese and Koreans possess unique clades within each Haplogroup as well as sharing other clades in common. This comparison is still helpful for it shows that the four nations are clearly related in being descendants from a common paternal ancestor in Japheth. Yet obviously reveals the distinction between the brothers Gomer and Javan and their descendants who are in turn cousins.
Something of interest we will note periodically on our journey, is the aspect that cousins can have a genetic similarity parallel with a similar personality and kinship which is as close as that of a sibling. Just as in everyday life, cousins can have a greater rapport with one another than with their own brother or sister.
What is immediately apparent is the affinity between brothers Elishah and Dodan in having higher Haplogroup K percentages, as distinct from their cousins from Gomer. The higher percentage of C, separates Korea, who are are already exposed as a maverick in Gomer’s family; in their choosing to dwell in an entirely different location from the rest of their relations – Chapter VI Togarmah & the Koreas.
As Malaysian men have similar levels of O1a and O1b with Vietnam and the Koreas, they do not with regard to Haplogroup O2. Whereas Filipino men do share a similar percentage of O2 with the Gomer nations but in O1a and O1b it is diametrically opposite.

Using our comparison table from previous chapters, with samples from Tiras, Madai and Gomer and charting two of the sons of Javan, we are presented with the following data.
O O2a O1a O1b C D K Q N
NA Amerindian 6 77
Kazakhstan 8 40 10 2 7
South Korea 79 42 3 33 13 2.5 0.5 2 4
Vietnam 79 40 6 33 4 3 7 3
Philippines 70 39 28 3 5 20
Malaysia 70 30 8 32 6 8
What does this tell us and what can we learn thus far? Regarding the more recent Haplogroup mutation Q, it is missing from Javan’s sons, but evident in three of Japheth’s seven sons studied so far. As discussed, it is the marker Y-DNA Haplogroup for the Amerindian – refer Chapter III Tiras the Amerindian.
It is the converse with the ancient Haplogroup mutation D, where it is exhibited only in Gomer’s sons. The oldest Haplogroup mutation C, is unsurprisingly found in all discussed so far and is found at higher levels in central and northern Asia. The northern Haplogroup N is missing from Javan’s children, yet evident in Vietnam – Chapter V Gomer: Continental South East Asia.
Interestingly, the major interconnecting Haplogroup K, stemming from the older Haplogroup F mutation does not it seems, follow a pattern. It is relatively absent in mainland south east Asia yet significantly higher in Javan’s island lands. An explanation for this may be linked with the Negritos population, particularly in the Philippines.
Relatively young Haplogroup mutation O, stemming from NO and before that, Haplogroup K, shows that as combined group O, it is the predominant Y-DNA marker Haplogroup for Japheth’s male descendants through Noah’s grandsons Gomer and Javan. It is worth highlighting how Gomer’s sons, Togarmah and Ashkenaz both possess exactly 79% of group O; and just as noteworthy, the two sons of Javan; Dodan and Elishah, have exactly 70% in Haplogroup O mutations.
The differences appear once Haplogroup O-M175 is split into O-M122, O-M119 and O-M268. It is the men from the Philippines who are the most unlike their brother and cousins; with far less O1b and considerably more O1a. For Haplogroup O2, the Filipinos are more aligned with their Gomer cousins than with Malaysia. Whether migration pathways have a bearing is a credible question. For the evidence shows that the Filipinos originated in Taiwan before dwelling in the Philippine archipelago. Did the Malays travel in the same direction from the same origin, or via south Asia instead?
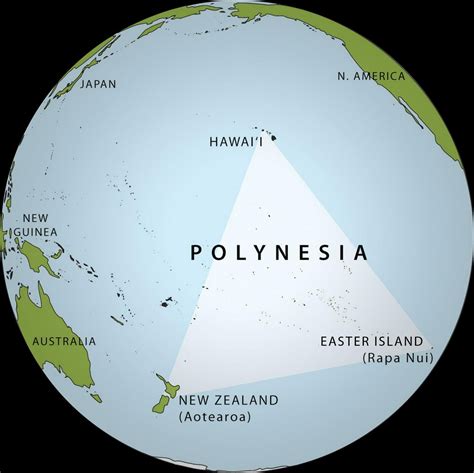
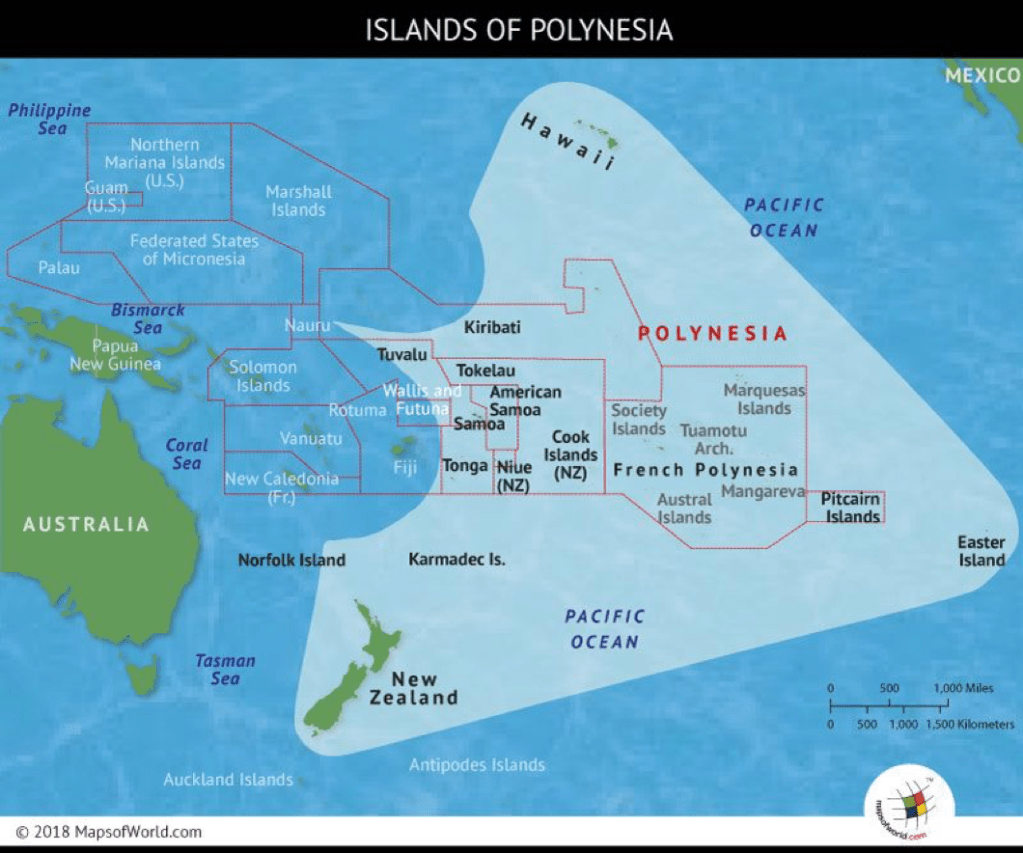
Returning to the relationship of Dodan with Rodan; it is proposed that Rodan equates with the Polynesian and Micronesian peoples of the Pacific and Oceania. Their locations include such diverse regions as Madagascar in the West, Hawaii in the North, Easter Island in the East and New Zealand in the South.
Riphath and Diphath of Gomer, modern Cambodia and Laos; were not a ‘scribal error’, but an indication of two peoples closely aligned, historically, culturally and ethnically – Chapter V Gomer: Continental South East Asia. One deriving from the other or less likely, Diphath was a later son of Gomer. Javan’s youngest son Dodan – the Dodanim – strangely mirrors, the same relationship with Rodan, the Rodanim.
The Origin of the Nations, Herman Hoeh, 1957 – capitalisation his, emphasis mine:
‘The Mauri, Milyaes and Gasgars migrated from the Mediterranean via Asia Minor… The Gasgars live on the Island of Madagasgar. The word “Madagasgar” means “Gasgars of the land of Madai! “The Milyaes are the Malayas of Southeast Asia; the Mauri are the Maori of the South Pacific, The Maori claim to have come from the West by ship from the land of “Raiatea” (AN INTRODUCTION TO POLYNESIAN ANTHROPOLOGY, by Peter Buck, page 14). Where was Raiatea? Some lost continent? NO! Raiatea was a land familiar to the Romans. They called it Raetia. It was located south of the Danube River… (SMITH’s CLASSICAL DICTIONARY).’
A number of researchers maintain the Polynesians sailed from South America across the Pacific Ocean to the Pacific Islands. In 1947, the Kon Tiki voyage by Thor Heyerdahl using a a Polynesian balsa wood raft sailed across the Pacific, westward from South America, beyond Easter Island to prove it could be done. Polynesians did sail that same direction, only after they had first sailed eastward to South America. When they returned, they brought with them bottle gourds, the paper mulberry tree and sweet potatoes called Kumara. All are found throughout the South Pacific, yet they are sourced from South American varieties. This transference of vegetation has confused some into thinking the Polynesians migrated originally from South America.
The Milyaes or Malays are linked to the Polynesians.
The Races of the Old Testament, A H Sayce, 1891, page 32 – emphasis mine:
‘It was the philologist, for example, who first suggested the common origin of the Malayo-Polynesian race. He found that the languages spoken by the race implied a common mother-speech at no very distant period, and thus made it possible that the speakers also were derived from a common stock.’
The Journal of the Polynesian Society Volume VII: The Malayo-Polynesian Theory III, John Fraser, 1898 – emphasis mine:
‘Scientists have also done much to spread the Malayo-Polynesian theory, chiefly Wilhelm von Humboldt, who, on the very first page of his great work (Über die Kawi Sprache auf der Insel Java), says, “Under this name – the Malayan race – I include the inhabitants of all the islands of the great Southern Ocean.”
‘The view which I take is a “new theory” so far as I am concerned, for I have never seen it stated by any other. It is shortly this: Whereas others maintain that a conspicuous portion of the Polynesian language has come from the Malays, I hold that these words were Polynesian before they became Malayan; that is, that the Malays, when they came into the Indian Archipelago, found a Polynesian language there from which they borrowed largely.
And further, I hold that in Indonesia the first dwellers were of the Melanesian stock, that the ancestry of the present Polynesians was grafted on that, and that the Malays are the last and latest settlement there. Thus I account for the well-known fact that the ground-work of the purely Melanesian languages shows many root-words in common with the languages both of the brown Polynesians and the Malays. Others say that these words come through the Malays; I say that the Malays were the borrowers.
“The truth, – the more it’s shook, it shines,” and every question as to the origin of our Polynesians and their speech ought to be worthy of a place in your Journal… for the Malay itself is a borrower from far earlier forms which came originally from India.”
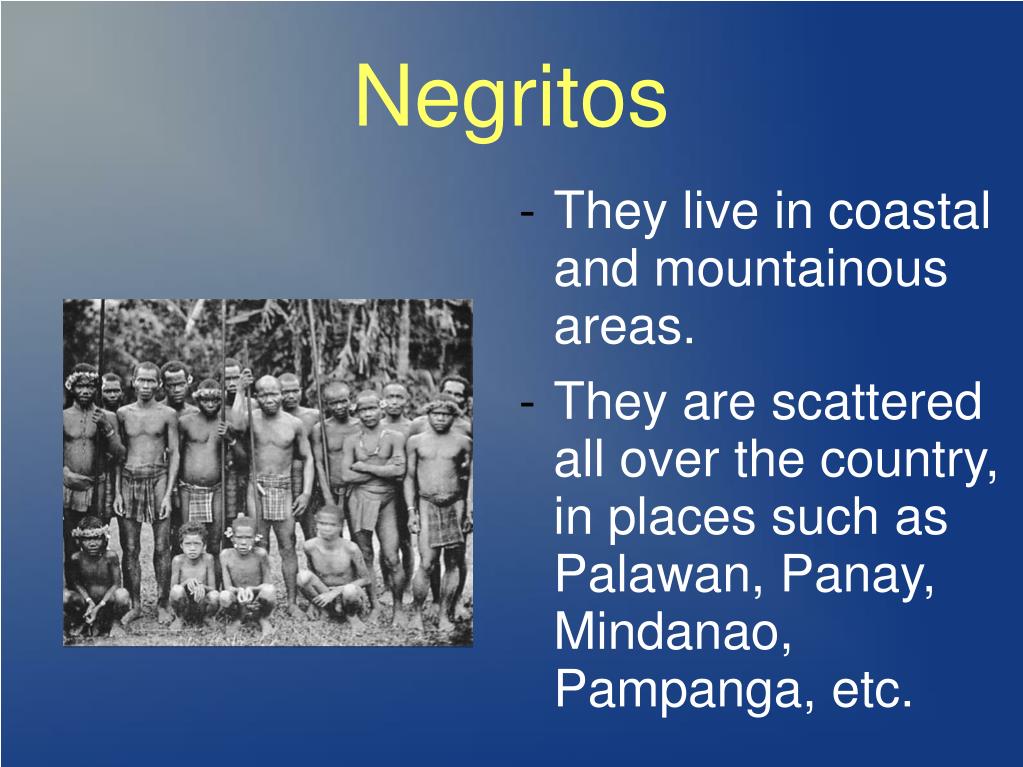
Negritos (Melanesians) of the Philippines
Ancient Origins, Caleb Strom – emphasis mine:
‘Although it is plausible that Polynesia was settled by ancient South Americans; all the genetic, linguistic, and ethnographic evidence points toward a predominantly southeast Asian origin. The two main theories today are called the Express Train Hypothesis and the Slow Boat Hypothesis.
The Express Train Hypothesis says that Polynesians originally [came] from Taiwan by way of the Philippines and Melanesia. According to this view, Polynesians are mainly a part of a migration wave that came out of Taiwan.
The western part of Polynesia was settled between 3000 and 1000 BC by people from Taiwan via the Philippines as well as parts of New Guinea. Eastern Polynesia was settled beginning around 900 AD as Polynesian voyagers began to set out from Tonga and Samoa and other islands of western Polynesia to settle the Hawaiian Islands, New Zealand, and Easter Island, among other islands of the region.
According to the Slow Boat Hypothesis, the ancestors of the Polynesians are of Austronesian descent and still have a connection to Taiwan, but the ancestors of modern Polynesians spent several centuries intermarrying with people of Papuan and Indonesian lineage before setting out to Polynesia.
The first view is supported by linguistic and ethnographic data, but there is genetic evidence for the second hypothesis. Genetic studies have shown, for example, that a significant percentage of the Polynesian population has y-chromosomal DNA [paternal] haplogroups coming from Papua New Guinea while most of the mtDNA [maternal] comes from haplogroups in Taiwan and Southeast Asia.
This suggests some degree of intermarriage between Polynesians and other Austronesian groups as well as non-Austronesian groups [Melanesians]. Another possible line of evidence for this hypothesis comes from the fact that there is a gap in the language evolution of Polynesian Austronesian languages. Polynesian languages have features that no other Austronesian languages possess. This could be because of interaction with Papuan and Indonesian populations.
A study in 2020 has suggested that the date for Polynesians meeting South Americans should be pushed back even further, to around 1150 AD. The nature of those genetic links and the location for that first contact also differs from previous beliefs.
As Ed Whelan writes:
“Genetic evidence appears to prove that Polynesians are related to present-day Indigenous people, especially from the coast of Colombia and Ecuador. Interestingly, the DNA study concludes that the earliest contact was on Fatu Hiva, an island in the South Marquesas islands, sometime around 1150 AD, and not Rapa Nui which is much closer to the coast of South America.”
Is it possible that Amerindian cultures are partially responsible for the colonization of Polynesia, or at least part of it, after all? Although it is possible that South American voyagers sailed to Polynesia to meet the Rapa Nui or another group of Polynesians, the Polynesians are known to have been more skilled at seafaring at the time, so it is more likely that it was the Polynesians who came to the Americas.
The Polynesians may have come to South America to trade with the natives, and as a result may have ended up also bringing home South American brides. Intriguingly, there is circumstantial evidence for pre-Columbian contact between Native Americans and Polynesians – chicken^^ bones that have been found at an archaeological site on a beach in Chile that appear to predate the coming of the Spaniards.
Regardless of where the Polynesians originally came from, their ancestry appears to be more complex than initially thought. The more we learn about historical genetics the more we realize just how convoluted the communication and intermarriage between different populations was in the past. If we go far back enough, current thinking is that we are all a mixture of many lineages of mankind which originally diverged from a single lineage that goes back to Africa, perhaps 200,000 years ago.’
All the way back to mitochondrial Eve, though both the time frame and the origin in Africa are gravely disputed due to inconsistencies in dating methods.
Ancient Origins, April Holloway – emphasis mine:
‘Research into the origins and dispersal of Polynesian chickens^^ has helped scientists reconstruct the early migrations of the Polynesians and the animals they carried with them. The results revealed that the Philippines is the most likely ancestral homeland of the Polynesians, whose forebears colonised the Pacific about 3,200 years ago.
Polynesian seafarers explored vast areas of the Pacific and settled nearly every inhabitable island in the Pacific Ocean well before European explorers arrived in the 16th century. However, the ancestral relationships of people living in the widely scattered islands of the Pacific Ocean have long puzzled anthropologists.
The predominant theory is that the Polynesian people are a subset [Rodanim] of the sea-faring Austronesian people [Dodanim] who have their origins in Taiwan, having arrived there through South China about 8000 years ago. From there it is believed that they spread out across the Pacific [via the Philippines] to Polynesia, a sub-region made up of over 1,000 islands [Javan] scattered over the central and southern Pacific Ocean.’
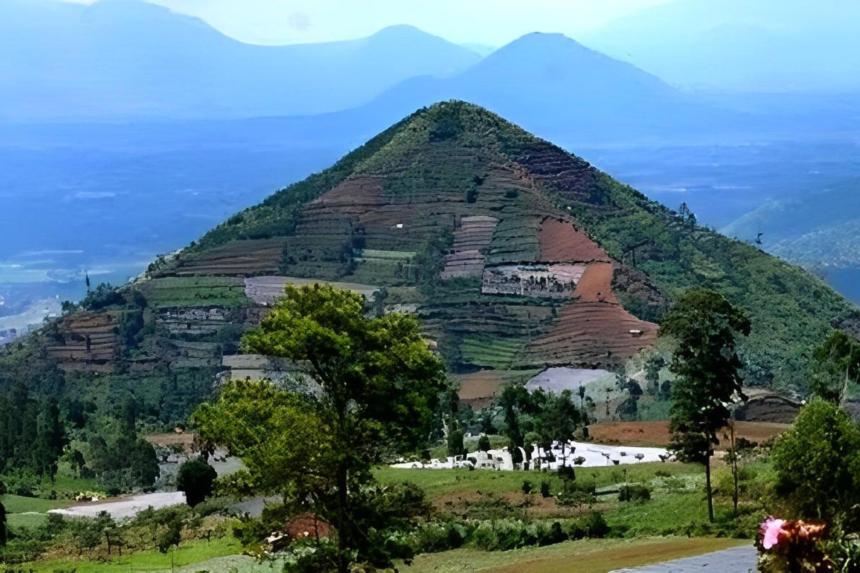
Eight thousand years ago would be circa 6000 BCE. This fits the time frame after the dispersal of all the post-flood peoples at the time of Peleg and the Tower of Babel, about 6755 BCE according to an unconventional chronology – Chapter XXI The Incredible Identity, Origin & Destiny of Nimrod; and article: The Pyramid Perplexity.
Holloway:
‘It is thought that by roughly 1400 BC, the ‘Lapita People’, so-named after their pottery tradition, appeared in the Bismark Archipelago of northwest Melanesia. This culture is seen as having adapted and evolved through time and space since its emergence “Out of Taiwan”. Within a mere three or four centuries between about 1300 and 900 BC, the Lapita archaeological culture spread 6,000 km until it reached as far as Fiji, Tonga, and Samoa.’
It is widely held speakers of Austronesian languages began spreading from Taiwan into Island Southeast Asia. There are three theories, regarding the dispersion of peoples across the Pacific to Polynesia. These are outlined by Kayser in 2000 and are as follows:
- Express Train model: A recent (c. 3000–1000 BC) expansion out of Taiwan, via the Philippines and eastern Indonesia and from the northwest of New Guinea, on to Island Melanesia by roughly 1400 BC. Reaching western Polynesian islands around 900 BC. This theory is supported by the majority of current genetic, linguistic and archaeological data.
- Entangled Bank model: Emphasizes the long history of Austronesian speakers’ cultural and genetic interactions with indigenous Island Southeast Asians and Melanesians along the way to becoming the first Polynesians.
- Slow Boat model: Similar to the express-train model but with a longer hiatus in Melanesia along with admixture – genetically, culturally and linguistically – with the local population. This is supported by the Y-chromosome data of Kayser, which shows that all three* haplotypes of Polynesian Y chromosomes can be traced back to Melanesia.
Polynesians acquired a reputation as great navigators – their canoes reached the most remote corners of the Pacific in keeping with Javan’s association with isles and the sea – allowing the settlement of islands as far apart as Hawaii, Rapanui (Easter Island) and Aotearoa (New Zealand). The people of Polynesia accomplished this voyaging using ancient navigation skills of reading stars, currents, clouds and bird movements – skills passed to successive generations down to the present day.
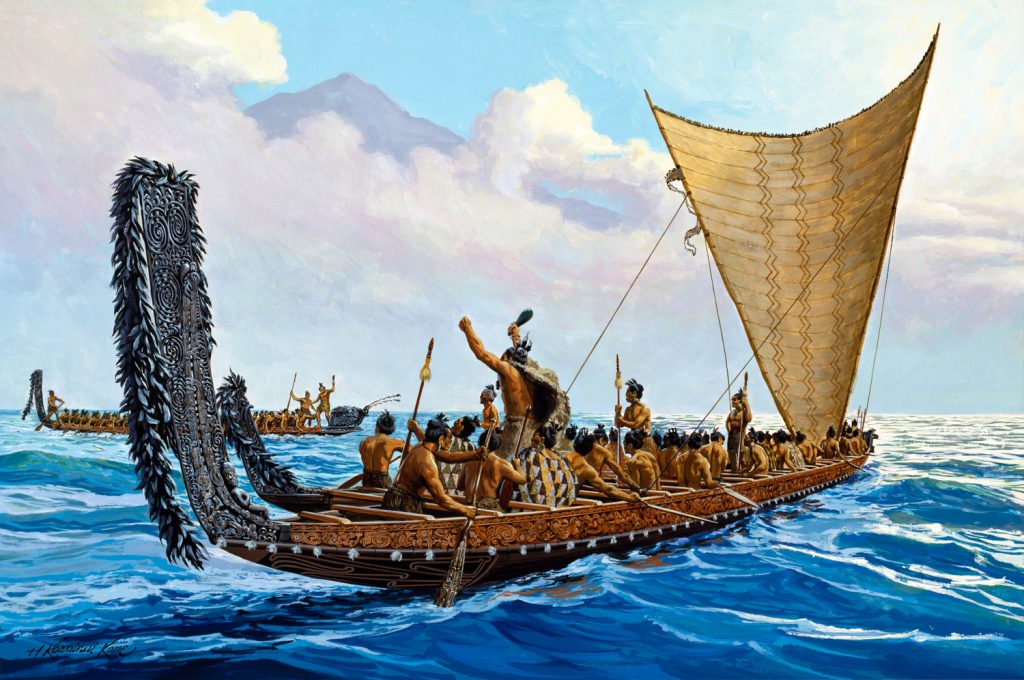
Ocean going war canoes of the New Zealand Maori
Fast Trains, Slow Boats, and the Ancestry of the Polynesian Islanders, S Oppenheimer & M Richards, 2001 – emphasis & bold mine:
‘Our study provides evidence for a dual genetic origin of Pacific Islanders in Asia and Melanesia. This is in agreement with the Slow Boat hypothesis of Polynesian origins (Kayser, Brauer et al. 2000) according to which Polynesian ancestors originated in Asia, moved eastward, and mixed extensively with local Melanesians before colonizing the Pacific Islands. Although dating methods revealed somewhat similar entries of NRY/mtDNA haplogroups into Polynesia, haplotype sharing suggests that haplogroups of Melanesian origin may have appeared earlier in Polynesia than those of Asian origin, although more extensive sampling in Melanesia is needed to confirm this observation.
The striking difference observed here between Asian and Melanesian contributions to the paternal and maternal gene pool of Polynesians suggests an admixture bias toward more Melanesian men, perhaps as result of uxorilocal (matrilocal) residence and matrilineal descent in ancestral Polynesian society (Have and Marck 2003)…
Fiji played a pivotal role in the history of Polynesia: humans probably first migrated to Fiji, and subsequent settlement of Polynesia came from Fiji.
After analysis of mitochondrial DNA [maternal mtDNA] and Y [sex] Chromosome DNA [paternal Y-DNA], Atholl Anderson stated: “the ancestors of Polynesian women came from Taiwan while those of Polynesian men came from New Guinea. Subsequently, it was found that 96% of Polynesian mtDNA has an Asian origin, as does one-third of Polynesian Y chromosomes; the remaining two-thirds from New Guinea and nearby islands; this is consistent with matrilocal residence patterns.
Polynesians existed from the intermixing of few ancient Austronesian-Melanesian founders, genetically they belong almost entirely to the Haplogroup B (mtDNA), which is the marker of Austronesian expansions.” The high frequencies of mtDNA Haplogroup B within the Polynesians is the result of ‘founder effect’, representing the descendants of a few Austronesian females who had intermixed with Papuan men.’
A 2010 study using meta-analysis of the most reliable radiocarbon dates available, suggested that ‘the colonisation of Eastern Polynesia [including Hawaii and New Zealand] proceeded in two short episodes: in the Society Islands from 1025 to 1120 AD and further afield from 1190 to 1290 AD, with Easter Island being settled around 1200.’
Recent archeological models have projected more likely dates between 300 to 800 CE for the settlement of Easter Island and a date of 500 CE has been suggested for Hawaii. Linguistically, there is a very distinct East Polynesian subgroup, sharing a number of innovations not seen in other Polynesian languages. Hawaiian and Maori oral histories support this, for the earliest varieties of New Zealand Maori speech have multiple sources from around central Eastern Polynesia.
Genetic History of Polynesians and New Zealand Maori… Edana Lord – emphasis and bold mine:
‘As people moved throughout the Pacific and into Polynesia, genetic interactions took place. The movement of mitochondrial haplogroups represent the migration of people from South East Asia through Near Oceania into Polynesia. B and Q are two such haplogroups which made it through to Polynesia.
The B4 subclade arose… [and]… diverged into many more subclades including B4a1a which is restricted to Taiwan, Island Southeast Asia and the Pacific. The lineage B4a1a1 is prevalent in Near Oceania and has become almost fixed in Polynesia, making up more than 90% of all Polynesian mtDNA haplotypes.
Haplotypes from the Q1 lineage have also been reported in Polynesia, in particular Gambier and the Cook Islands.
The majority of the haplotypes can be found within the B4 clade, which is well represented in South East Asian and Pacific regions. Within each of the three populations, haplotypes derived from the B4a1a1 haplogroup was the most common. This haplogroup is seen in high frequency throughout Polynesia, Micronesia, Coastal Papua New Guinea, Solomon Islands and Philippines. As this is common to all of the populations investigated here, it shows that they have a shared ancestry.’
This is confirmation of the genetic link between the Filipinos, the Polynesians and Micronesians. One that we would expect for the Dodan and Rodan connection hypothesis. In addition, we can include Polynesians – in the thread which unites maternal inheritance in Japheth’s descendants through the unifying mtDNA Haplogroup B – with the Amerindian; Central Asians; and South East Asians.
Lord: ‘One haplotype common to all three populations is B4a1a1a…^ which is thought to have arisen in the Bismarck Archipelago. The haplotypes can be separated into those from West Polynesia (Tokelau) and those from East Polynesia (French Polynesia and New Zealand). The haplotypes seen in West Polynesia are found deeper in the B4 clade than those from East Polynesia. This can be used as further evidence of population migration from West to East.
There are also haplotypes present in East Polynesia that are not seen throughout West Polynesia, such as the B4a1a1c haplotype… This can represent novel mutations in the expanding Polynesian populations or possibly genetic interactions with other groups of Polynesia and Micronesia.
The haplotypes present in the New Zealand population [of the Maori] are most similar to those from French Polynesia, for example haplotype B4a1a1m… This haplotype is restricted to the French Polynesian and New Zealand Maori populations. This contributes further to the hypothesis that New Zealand Maori are descended from Eastern Polynesians.’

The New Zealand Maori
Complete mitochondrial DNA sequences provide new insights into the Polynesian motif and the peopling of Madagascar, Multiple Authors, 2009 – emphasis mime:
“The ‘Polynesian motif’, popularly named for its high frequency among Polynesians, is characterized by a well known series of mitochondrial DNA (mtDNA) polymorphisms that now define haplogroup B4a1a1a…^ This lineage probably developed in eastern Island Southeast Asia or Near Oceania, during the mid-to late-Holocene, with recent dates suggesting an origin around 6,200 – 10,900 years before present (YBP)… The haplogroup’s immediate precursor… has been found in Taiwanese aboriginal groups with an estimated age of 13,200 YBP… This incremental series of dates are consistent with a model whereby Austronesian speaking populations expanded out of Taiwan during the mid-to-late-Holocene… Ultimately, the Austronesian expansion spread the immediate ancestor of the Polynesian motif, and later the motif itself, over a vast geographical area – from Taiwan in the north, New Zealand in the south, remote Polynesia in the east, and finally, Madagascar in the far west.”
These dates selected by scientists are closer to events recorded in the Bible than they realise. If we could marry scientific data with the biblical record, then it would be difficult for either side to continue disbelieving the credentials of the other. The dating of 10,900 to 6,200 years ago would be 8880 to 4180 BCE and fits a dispersion of peoples during the life of Peleg – Genesis 10:25; 11:9.
If we calculate enough time for the migrations of Japheth’s descendants from Kashmir, the Indus Valley, Asia Minor and Greece; allowing for the dispersion of peoples during the Tower of Babel incident circa 6755 BCE – and then for the movement of Javan’s grandchildren descended from Dodan (Filipinos) and Rodan (Polynesians) through Asia, it was very likely during this time frame lasting from 8000 to 4000 BCE.
The subsequent migrations from Taiwan into the Philippines, Papua New Guinea and beyond into settling the western regions of Polynesia would then fall into the proposed dates offered by scientists of 3000 BCE to 1000 BCE.
The date of 13,200 years ago would equate to 11,180 BCE and this is interesting, as it falls between the birth of Japheth and the time of the Flood. The Flood occurred circa 10,837 BCE – refer Chapter I Noah Antecessor Nulla; and Chapter XXII Alpha & Omega.
Japheth was born circa 11,800 BCE according to an unconventional chronology. Japheth as we have discussed, would have inherited and carried the genetic code and potential Y-DNA Haplogroup mutations that we now associate with the East Asian and Southeast Asian peoples. This would have obviously included the all important defining mutation that would become the mtDNA B Haplogroup received from his mother and or carried by Japheth’s wife. This then would mutate into all the B clades; including B4a1a1^ which the Polynesians (Rodan) extensively exhibit.
“The Polynesian motif is currently found at highest frequency in Polynesia, where it approaches fixation in some populations. It is also common in Micronesia and parts of Near Oceania, where it is not necessarily restricted to Austronesian speaking populations, but also occurs in some rare Papuan speaking groups [evidence of ancient admixture with Melanesians].
The motif is much less frequent in Island Southeast Asia, although it has been found sporadically in both central and eastern Indonesia. In Madagascar – the western edge of the Austronesian expansion – the Polynesian motif reaches a frequency of around 20%, thus leading to proposals that the island was settled by an Indonesian population, which later colonized the Pacific Islands, or even more speculatively, by direct migration from Polynesia itself.
Furthermore, these studies revealed that Indonesians have a major role in the colonization of Madagascar, and highlighted Borneo as a likely source of the Asian-derived Y chromosomes found in Malagasy today. This is consistent with linguistic evidence suggesting that the Malayo-Polynesian language spoken by Malagasy is related to the Barito language of southern Borneo.
Currently, our best model for the settlement of Madagascar suggests that the first settlers reached the island [some] 1500-2000 years ago, when there is clear archeological and paleoecological evidence of their occupation. Ultimately, a complex – and largely unknown – genetic and linguistic admixture process between populations of African and Southeast Asian descent produced the Malagasy we recognize today.
We observed the Polynesian motif at relatively high frequency in all three Malagasy groups: 50.0% in Merina, 21.8% in Vezo, and 13.4% in Mikea… Indeed, the first and second phases of our analysis revealed that 58 of the 266 Malagasy shared a set of mutations… which assign them to haplogroup B4a1a1.”^

There is a genetic line running through the mtDNA B4a1a1 Haplotype, from the Polynesians and Micronesians descended from Rodan, to the Filipinos of Dodan and then to their ancient ancestral home on the former Island of Formosa, now called Taiwan.
Melanesian and Asian Origins of Polynesians: mtDNA and Y Chromosome Gradients Across the Pacific – Molecular Biology and Evolution, Kayser, 2006 – emphasis & bold mine:
‘According to researchers, Y-DNA (direct paternal lines) in Polynesia has more haplogroup variations than mtDNA (direct maternal lines); however, about 75% reporting their paternal line as Polynesian are in one of the below three Y-DNA haplogroups:
1) Haplogroup C[1b3a (M38) M208]
This is the haplogroup of about 34% who report their paternal line as Polynesian. C1b3a [formerly C2] is found in Polynesia, Melanesia, New Guinea, and Indonesia.
2) Haplogroup O[2] (M122)
This is the haplogroup of about 24% who report their paternal line as Polynesian. O2a1 [L127] is typical of populations of East Asia, Southeast Asia, and culturally Austronesian regions of Oceania [Polynesia and Micronesia], with a moderate distribution in Central Asia.
3) Haplogroup K (M9)
This is the haplogroup of about 18% who report their paternal line as Polynesian. K is an old lineage presently found only at low frequencies in Africa, Asia, and in the South Pacific. One descendent line of this lineage is restricted to aboriginal Australians [K2*], while another is found at low frequency in southern Europe, Northern Africa, and the Middle East.’

A Samoan family
The Polynesians are spread across Oceania. The regions with significant populations include in descending order:
New Zealand – 887,338
USA – 820,000
French Polynesia – 215,000
Australia – 210,843
Samoa – 192,342
Tonga – 103,036
Canada – 10,760
Tuvalu – 10,645
Chile – 5,682
A comparison of the main Y-DNA Haplogroups for the principal Polynesian centres of population travelling west to east, including their purported original homeland on Taiwan and the stopping off point the Philippines; before migrating into the Pacific proper.
There are two main sets of Haplogroups for Taiwan: the Han Chinese and of more interest to this discussion, Taiwanese Aborigines, which we will use here.
Taiwan: O1a – O2 – O1b – C
Philippines: O2 – O1a – K – C – O1b
Philippine Negritos: K – O2 – C – P
Micronesia: K – C – O
Papua New Guinea: M – C – K – O
Australian Aborigine: C – K – O
Solomon Islands: K – O – M
Vanuatu: K – M – C – O
Tuvalu: O – K – C
Fiji: M – K – C – O
Tonga: O – C – M – K
Samoa: C – O – K – M
Maori: C – O – K
Cook Islands: C – K – O
Tahiti: C – O – K
French Polynesia: C – O – K
Placing the island nations into geographic clusters highlights a band running from Papua New Guinea and northern Australia in the West to French Polynesia in the East. New Zealand is to the south of this latitude boundary and Taiwan, the Philippines and Micronesia to the North.
What is immediately identifiable is that the nations to the North, south and far east maintain the core Y-DNA Haplogroups of South East Asians comprising C, K and O. They do not possess the defining Melanesian Haplogroup M, known as M-P256. It is the central clusters closest to New Guinea and Fiji which evidence admixture. We will address the Melanesian’s origin and identity in Chapter XIII India & Pakistan: Cush & Phut.
What is interesting to note, is that Haplogroup M derives from super sub-Haplogroup K; specifically K2b1 (formerly K2b1d). M-P256 is the most frequently occurring Y-chromosome Haplogroup in West Papua and Western Papua New Guinea and is found in Melanesia and in Indonesia. Coupled with Haplogroup S (B254), it is a primary sub-clade of K2b1 and together known as MS*.

In some ways, there are more questions than answers. For instance in Taiwan, the Han Chinese are similar with mainland Han Chinese, but not the same. The Taiwanese Aborigines do not resemble the Han or the Filipinos, so they are a bit of a quandary as to where their Y-DNA places them; with Javan or another son of Japheth?
The Polynesians, Micronesians and Melanesians all share the key Asian Y-DNA Haplogroups C1, K2 and O2 in varying degree. The Melanesians with their darker skin shades are more of a mystery. The Fijians in part and especially the Papuan New Guineans and the Australian Aborigines have facial features more reminiscent of the Dravidian Indian of southern India and the Sri Lankans, than they do of Polynesians – Chapter XIII India & Pakistan: Cush & Phut.
Their higher percentages of Haplogroup K, plus M show they are different, yet neither of these Haplogroups are indicative of the Indian or Sri Lankan – Haplogroup M not at all and K only partially.

As geneticists claim, it appears that Polynesians have intermarried with Melanesians from principally Papua New Guinea and Fiji, while fanning out from Taiwan originally and later the Philippines. The shared higher levels of K and the additional M Haplogroup mutations amongst the Polynesians and Melanesians is undoubtedly evidence of intermarriage over a lengthy period of time as proposed by the Slow Boat Model.
Taiwan: O1a [66.3%] – O2 [11%] – O1b [10.6%] – C [0.4%]
Philippines: O2 [39%] – O1a [28%] – K [20%] – C [5%] – O1b [3%]
Philippine Negritos: K [51%] – O2 [14%] – C [11%] – P [5%]
Micronesia: K [65%] – C [18.7%] – O [9.4%]
The Taiwanese Aborigines show a low level of genetic intrusion, based on the dominant Haplogroup O1a; plus, the very high percentage for combined Haplogroup O, reveals endogamy, resulting in a relatively undiluted gene pool compared to everyone else in East Asia. The Micronesians meanwhile have Haplogroup K as their predominant Y-DNA Haplogroup, as opposed to the more recent O mutation.
Papua New Guinea: M [59.6%] – C1 [17.3%] – K [8.3%] –
O [9.1%] – C [0.4%]
Australian Aborigine: C1b3b [60.2%] – K [22.2%] – C [6%] –
O [0.9%]
It is with the Melanesian inhabitants of Papua New Guinea that we see Haplogroup S which is a mutation linked with M. It is at 12.3 %, whereas the highest levels are usually associated with Australian aboriginal men with up to 40.9%* (Karafet 2015).
Polynesian Islanders who exhibit Haplogroup S, include Vanuatu with 6.4%; Solomon Islands with 3.1%; Samoa with 1.6%, as well as a few others. The Papuans possess the highest levels of Haplogroup M as their predominant Y-Chromosome group as expected of Melanesians, yet the Australian aborigine remains an enigma for they do not have M as their principle Haplogroup; yet they do possess a high level of S.*
Solomon Islands: K [59.4%] – O [28.1%] – M[9.4%]
Vanuatu: K [40.6%] – M [29.5%] – C [17.5%] – O [4.3%]
Fiji: M [35%] – K [25%] – C1 [21.5%] – O [13%] – C [0/9%]
Fiji, like Malaysia shows evidence of an Indian presence in its demographic with small levels of Haplogroups R2a, R1a, H and J. Fiji’s principle Haplogroup as a typical Melanesian sample is M. The Solomon Islands and Vanuatu, like Micronesia with the highest levels, have a Haplogroup predominance in K; though they are Melanesian and not Polynesian.
Tuvalu: O [45%] – K [36%] – C1 [17%]
Tonga: O [60%] – C [23%] – M [8%] – K [1%]
Samoa: C1 [61.3%] – O [26%] – K [3.2%] – M [3.2%]
The Tongans have the highest ratio of Haplogroup O, in common with Taiwan. Samoa and Tonga are a mirror image of each other. Samoa begins those Islands which are dominated neither by Haplogroup O, K or M, but rather C. Like Tonga, there is evidence of intermarriage with Melanesians en route to their final island homelands. Whereas, nearby Tuvalu does not show ostensible intermixing.
Maori: C1 [42.6%] – O [5.6%] – K [1.9%]
Cook Islands: C1 [83.3%] – K [7.5%] – O [4.6%]
Tahiti: C1 [66.7%] – O [29.2%] – K [4.2%]
French Polynesia: C [53%] – O [37%] – K [8%]
The Maori men like the Samoans are predominant in Haplogroup C as is French Polynesia and particularly the relatively undiluted Cook Islands with the highest percentage of C in the Pacific.
O C K M
Tahiti 29 67 4
Cook Islands 5 83 8
Maori 6 43 2
Samoa 26 61 3 3
Tonga 60 23 1 8
Tuvalu 45 17 36
Micronesia 9 19 65
The islands towards the northwest of the greater Polynesia and Micronesia region and by implication closer to the Philippines have very high frequency levels of Haplogroup K compared to the islands further east and south. In line with the Negritos of the Philippines as well as in part the Filipinos themselves. This region’s defining marker Haplogroup K, is the same as for the Solomon Islands and Vanuatu in the Melanesian zone to the southeast.
Meanwhile, Haplogroup C1 follows an opposite trajectory, in that it spikes just past Melanesia to very high levels in the Samoans, Tahitians and especially the Cook Islanders. Yet all of these islands, including the Maori, possess very low levels of Haplogroup K2.
The prime defining East Asian Haplogroup O follows a different pattern again. In that it is sparse in the far northwest of the Micronesian zone where K dominates, then increases towards the centre of the band with high levels in Tuvalu and Tonga; decreasing again eastwards with finally another spike in the far eastern region of French Polynesia.
Tuvalu is worth noting in that it not only occupies a central position in the band from an east to west and a north to south ratio, but also its percentages of the three key Haplogroups of O, C and K are the most evenly spread. In line with Vanuatu with an even spread of K, M and C respectively and Fiji with M, K and C respectively; each within the central zone.
Returning to the comparison table with samples from Tiras, Madai, Gomer, Javan and now his grandson (or son), Rodan.
O O2a1 O1a O1b C D K Q N
NA Amerindian 6 77
Kazakhstan 8 40 10 2 7
South Korea 79 42 3 33 13 2.5 0.5 2 4
Vietnam 79 40 6 33 4 3 7 3
Philippines 70 39 28 3 5 20
Malaysia 70 30 8 32 6 8
Taiwan: 88 11 66 11 0.4
Micronesia 9 19 65
Tuvalu 45 17 36
Tonga 60 23 1
Samoa 26 61 3
Cook Islands 5 83 8
The enigmatic Taiwanese aborigines stand out for a number of reasons. Compared to their East Asian relatives, they possess an extraordinarily low level of Haplogroup C; a low level of O1b, only matched by the Filipinos; a low level of O2 and contrastingly, an exceptionally high percentage of O1a. Then combining the O clades, the Taiwanese have an incredible 88% for Haplogroup O; with no Haplogroups K, D, Q, or N.
Similarly for the Polynesians, they have no D, Q or N Haplogroups just like the other sons of Javan; the Philippines and Malaysia. The prime East Asian Haplogroup O is low on the outskirts of Polynesia, but increases considerably towards its epicentre, yet still not approaching the levels of the Philippines for example. Haplogroup C is quite the opposite and aside from Kazakhstan, the sampled Polynesian males all exhibit higher percentages of Haplogroup C, with the staggering 83% in the Cook Islands.
The connecting Haplogroup K is interesting, as the pattern is random and though the Polynesian sample all possess K, it is variable – with those Polynesians and Micronesians closer to the Philippines possessing very high percentages, such as the 65% in Micronesian men.
One can’t help but think that the original predominant Haplogroups for Polynesian males were O or C and to a far lesser degree perhaps K. Intermarrying and admixture with the Melanesians who appear to have had K then M as their dominant Y-DNA Haplogroup, meant an increase in these and a decrease in O and C overall. With the opposite impacting Melanesian men. The variance for each group highlighting how lengthy a period the intermarrying occurred, as well as how many of the population were intermixing.
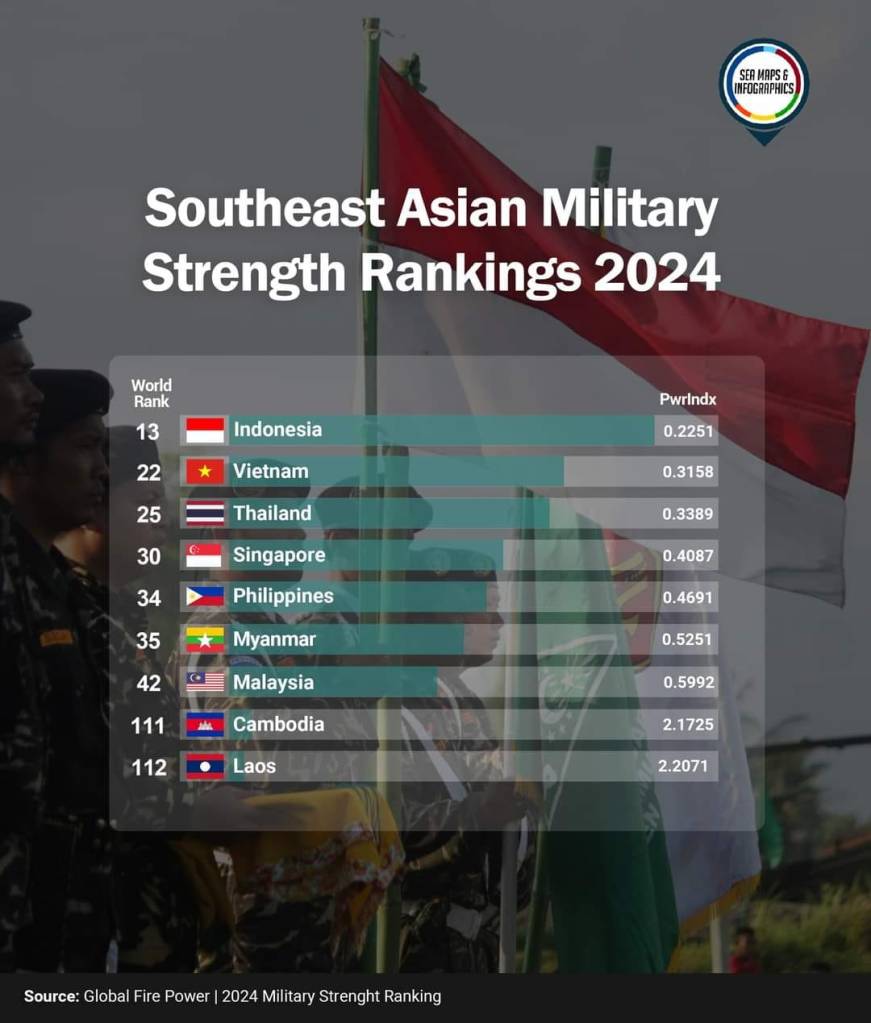
Chapter eight shines a light on an easily over looked island nation in South East Asia descended from Javan – which while in the shadow of the Asian giant that is China on the mainland, is set to awaken as an economic and military power house not just in Asia but on the world stage at large.
Happy is the person who finds wisdom, the one who gets understanding. Wisdom is worth more than silver; it brings more profit than gold.
Proverbs 3:13-14 New Century Version
“If the majority doesn’t laugh at you, beware that you must be saying something wrong. When the majority thinks you are a fool, only then is there some possibility of you being a wise man.”
Laozi
© Orion Gold 2020 – All rights reserved. Permission to copy, use or distribute, if acknowledgement of the original authorship is attributed to orion-gold.com