The following is an answer reproduced from Quora, to the question: Which countries will be major world powers in 2050?
This is a fascinating question.
In many ways, it is more of a curiosity to know how the geopolitical order will look not just in 2050 but in 2100, or even 2250…
In thinking about this question seriously, it seemed delving into the past was required to discern the future more knowledgeably. A study of the powers of the past, both small and great, highlighted a couple of salient points.
Firstly, while some countries – as either regional or great powers – wax and wane, there are those nations which have remained relatively constant as world powers over the past five hundred years.
Secondly, even though a nation may have a large population, economic clout or a formidable military, they are not necessarily a threat to world peace. They may have the form or substance of a power but it does not necessarily translate towards affecting the world’s stability or order.
A people or national identity which has a proclivity towards policies of imperialism, militarism and is prepared to use their weaponry to achieve their aims on the other hand, is surely to be considered a (major) power.
It is primarily from this perspective that this article will focus with regard to potential major world powers in 2050 and beyond.
Historically, it has taken many decades or centuries even, for a nation’s status to change. For instance, the United Kingdom has transitioned from the world’s dominant power in 1820 to a (global?) regional power in 2022.
What is partially surprising – reflecting its very gradual decline over two hundred years – is that Great Britain (and Northern Ireland) has slipped from the world’s third largest economy in 1820, to only the sixth largest in 2019.
We now live in an interconnected world which is far more precarious; one that seems to be close to a tipping point at any given moment financially and economically. It is impossible to calculate how quickly circumstances could change globally, let alone for individual nations.
A further factor, is how quickly nations can adapt to a fast paced changing world in the 21st Century and how much investment they spend on the cutting edge technologies that will have an immeasurable influence on the pecking order of the major world powers in the future. Three of these immensely important sectors include AI development, DNA and genetic research and Space exploration. The winners of these contests, will likely surge ahead of their rivals – refer article: The Great Reset & the Fourth Industrial Revolution.
Before concentrating on the prime powerful players in the world, past and present, let’s look initially at the minor (or lesser) powers of the past and today.
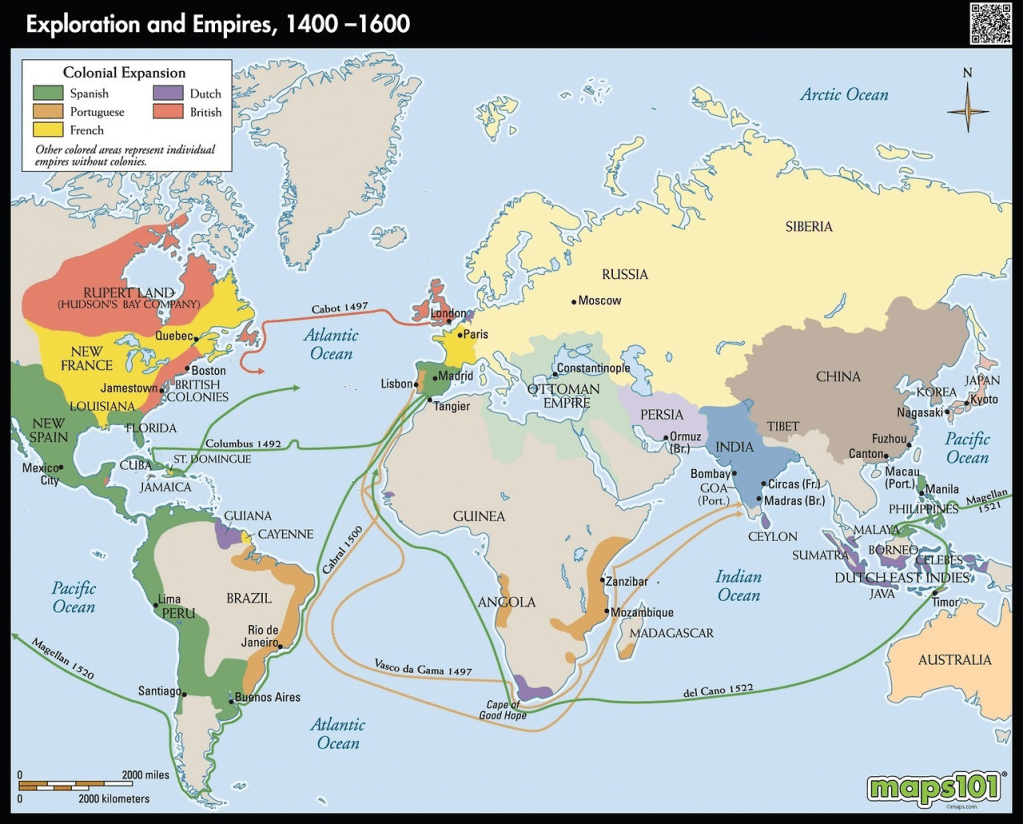
Both Portugal (1400s) and the Netherlands (1600s) are examples of minor powers who followed a different trajectory. Whereas the Netherlands still retains wealth and investment derived from its trading empire; Portugal does not reflect the wealth it once had stemming from its colonial empire. One would not consider them powers today. Similarly with the nation of Austria, which through its network of monarchy descended from the Hapsburg royal family throughput Europe and particularly in Spain and the Low Countries, created an extensive empire wielding considerable influence. Even with the dissipation of most of the European Monarchies, Austria has retained a measure of wealth much like the Netherlands, yet with a parallel loss of status in power.
Spain (1500s), France (1700s) and Great Britain (1800s) are examples of once being major powers, who combined trade with an expansionist colonial policy. To protect their claims and possessions it necessitated becoming naval and military powers, as was the case with the Netherlands. Each still retains economic wealth, with the United Kingdom and France having descended into lesser regional powers.
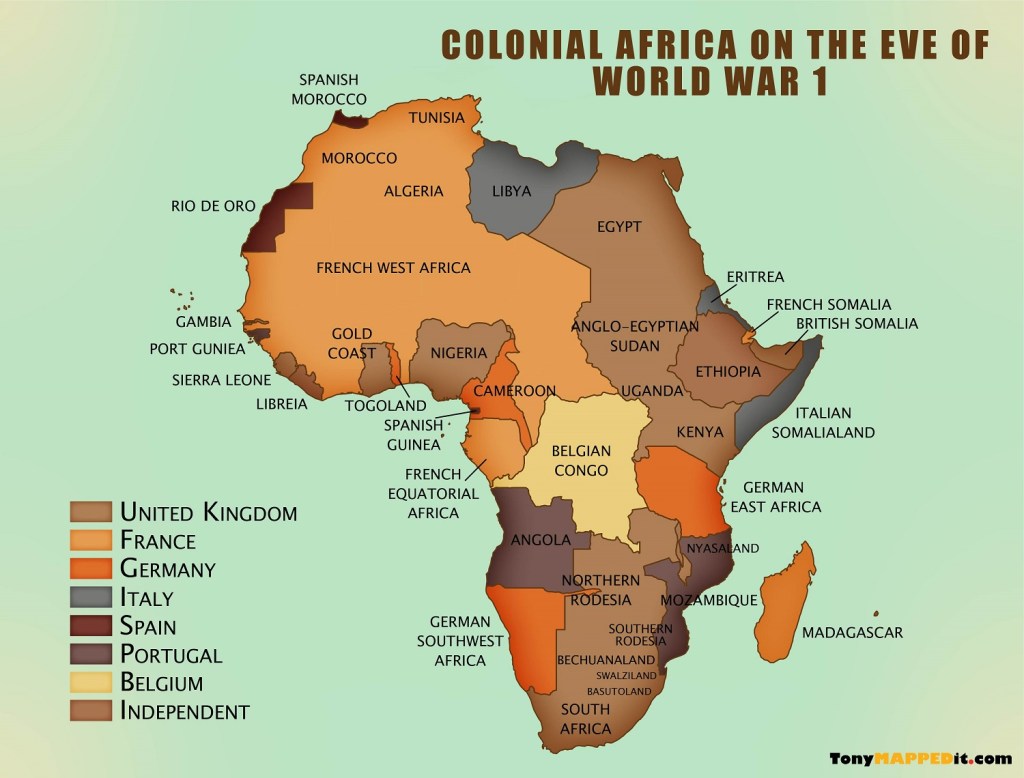
Colonial Asia
It is unlikely either could become major powers again, outside of the European Union at least. Nor have the French or English employed an overtly imperialistic policy since. Each during their mutual ascendancies, grew colonial empires, endeavouring to out do one another. As old rivals, both have settled into a grudgingly accepted stalemate draw.
A nation which does not fit into a power stereotype is Italy. It is a relatively young nation, created in 1861, though it did pursue a colonial expansion principally in Africa and briefly exhibited an imperialist motivation while under Mussolini’s rule. Yet, Italy’s national character does not appear to be predominantly thus focused and as a regional power, sits somewhere between Spain and France.
Today, there are a handful of nations which are regional powers that weren’t in the past. It would seem that each will grow in strength and stature; though it remains to be seen, which will become major powers.
Those nations include Brazil, Mexico, Indonesia, Iran, Pakistan, in part Turkey and perhaps the Koreas. The interesting exception in the list is Turkey, which was a major power in the past, in the guise of the Ottoman Empire.
There is a coded book which mentions these seven peoples (eight nations) – in fact all the peoples of the world either directly or indirectly – in both an historical and a modern context. Like the saying: ‘the truth is stranger than fiction’, their futures can be determined. Credence in this coded book is ridiculed by many, for they do not understand it. Besides, any acknowledgement that its words are true would then lead to admitting one who is superior, had authored and inspired it. So from here on, it is not just canny insight alone, but an accurate interpretation of its message, unforeseen prior to now – refer TheNoachian Legacy.
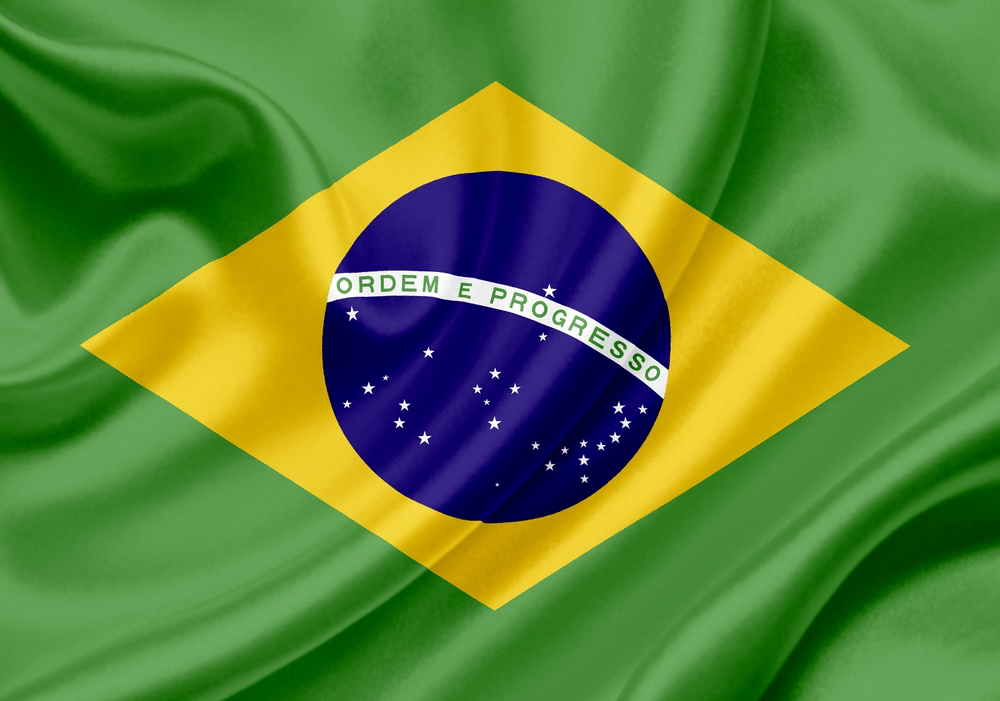
Brazil will stand to become a major economic power on the world stage, and all the Latino-Hispano nations of the Americas, led by the regional power Mexico, will align with Brazil in an economic trading bloc.
In large part to offset the dominance of the United States of America. Though Brazil will reach major power status, it will be primarily as an economic giant and not entirely in a military sense. Saying that, both Brazil and Mexico will increase their military capability in accord with their growing economic stature and one day will not be reticent in using them.
Brazilian Flag
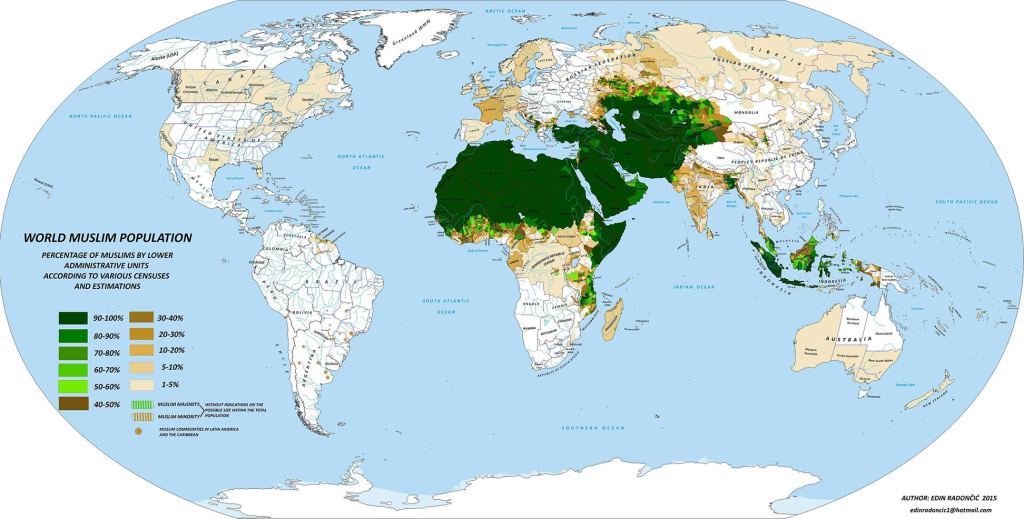
Indonesia, Iran, Pakistan and Turkey all have something in common and that is their Muslim faith. At a certain point, the dominant Islamic nations will amalgamate into a unified body with a single voice and purpose. Egypt also may have a prominent role, with the aforementioned four nations. How many other Arab peoples and Islamic nations, such as Bangladesh are part of this confederacy is not clear, though it will be a formidable military bloc and a series of wars will rage involving their alliance – refer article: Four Kings & One Queen. Again, it is not clear who the leader will be, though politically, the three countries comprising Turkey, Iran and Pakistan are clearly the dominant nucleus of nations. Turkey superficially seems to be the main contender, when considering its imperialistic role in the past and in possessing the strongest and fastest growing economy amongst the Muslim nations, aside from Indonesia.
The indication is that like any artificial joining, for instance the coterminous Yugoslavia and Czechoslovakia, or separation, such as East Germany and West Germany and North Vietnam and South Vietnam; eventually, no matter how unlikely, it will be undone. A reunified and far stronger Korea would be a fascinating scenario, added to the complex relationship currently amongst the northeastern Asian nations. Worryingly, it appears that a united Korea in the future could favour a Chinese inspired political model and focus on policy, as opposed to a Japanese one. This would indicate that any future support for reunification, is lead by China and or Russia and not from the United States.
Just before we turn to the major powers of the past and today, there is one nation, which is always forgotten. In fact, it was only in one person’s comments, though there may be more mentions as not every answer has been read. Ironically, this nation’s original name in the Hebrew language means: forgotten. Yet this nation is in the top ten nations of the world for largest economy by GDP. It is a unique country and the only one in the world which has the following combination of factors: for not only does it have vast resources on a huge landmass; it most importantly, has the infrastructure and space to host a vast number of new immigrants, thereby exponentially increasing its population. As a result, this nation’s economic, political and military influence would expand, as the most important ally of the United States.
That nation is… Canada.
Canadian Flag
Whether it will become a major power or a considerably stronger regional power remains to be seen, though its closet parallel would be Brazil in this regard.
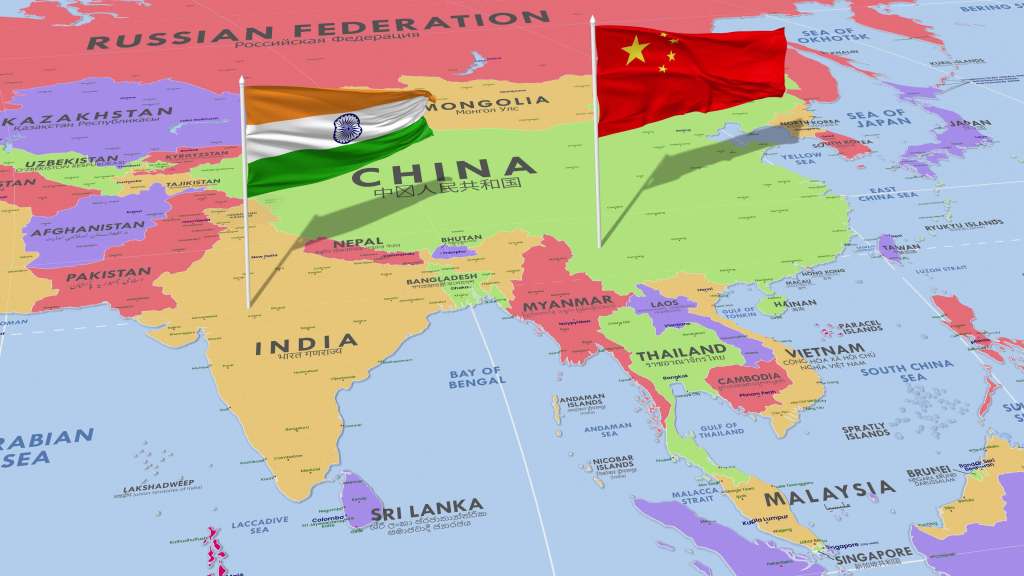
This leaves the historical major powers over the past five hundred years, depending on how one ranks them: China, Germany, India, Japan, Russia and the United States of America. A helpful article by Wendell Cox, highlights the points raised earlier regarding a large population or GDP and how it does not mean that particular nation wields global political, financial or military dominance. They can be a passive major power, or even dormant. What drives a nation to be an active major power is drawn from multiple variables – which makes this discussion interesting from an historical as well as a futuristic perspective. Also, a nation may become an active major power but only in a regional sense and not necessarily as a global presence.
500 Years of GDP: A tale of Two Countries, New Geography, Wendell Cox, 2015:
‘Over the 515 years from 1500 to 2015, the available data seems to suggest that the largest economy in the world [has] almost always been either China or the United States (for most years there is only incomplete data). In 1500, China was the largest economy in the world, followed closely by India, both with estimated GDP’s of approximately $100 billion. France was a distant third at approximately 18 billion… What is now the United Kingdom ranked 10th, at barely one quarter the output of France.
[The year 1700] was the only reported year between 1500 and 2015 that China or the United States did not lead the world. India had the strongest economy in 1700, closely followed by China. Throughout the entire period to the middle of the 20th century, China’s economy was larger than India’s by a relatively small margin. At the same time “the great powers” of the West were still well behind China and India…’
‘By 1820… India [in] second, [was] slightly more than one half that of China. The United Kingdom finally appears, in third-place with a GDP one sixth that of China… By 1890, the United States had emerged as the world’s largest economy, opening up an approximately five percent lead over China. India ranked third, followed by the United Kingdom [4th] and Japan [5th].
By 1930, the ascendancy of the United States was clear. China… still remained the second largest economy, but trailed the United States by approximately [two-thirds]. There was little difference between China and the next three largest economies, Germany [3rd], the United Kingdom [4th] and India [5th].’
The Flag of the United States of America
‘Half a century later, in 1980, the United States retained a similar lead, but now over second-ranked Japan. Germany was a close third… India ranked ninth, approximately 30 percent ahead of 10th ranked China. China’s ascendancy was obvious by 2010, reaching within 20 percent of the United States, which remained number one.
This had been a dramatic reversal, since China’s GDP had been little more than one tenth that of the United States only 30 years earlier (1980). India was also restored to a leadership position, ranking third. Japan was fourth and Germany was fifth.’
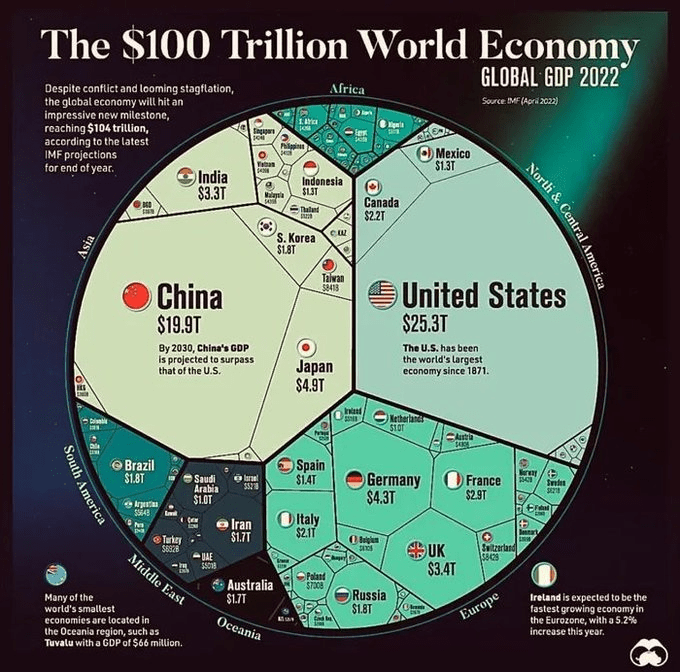
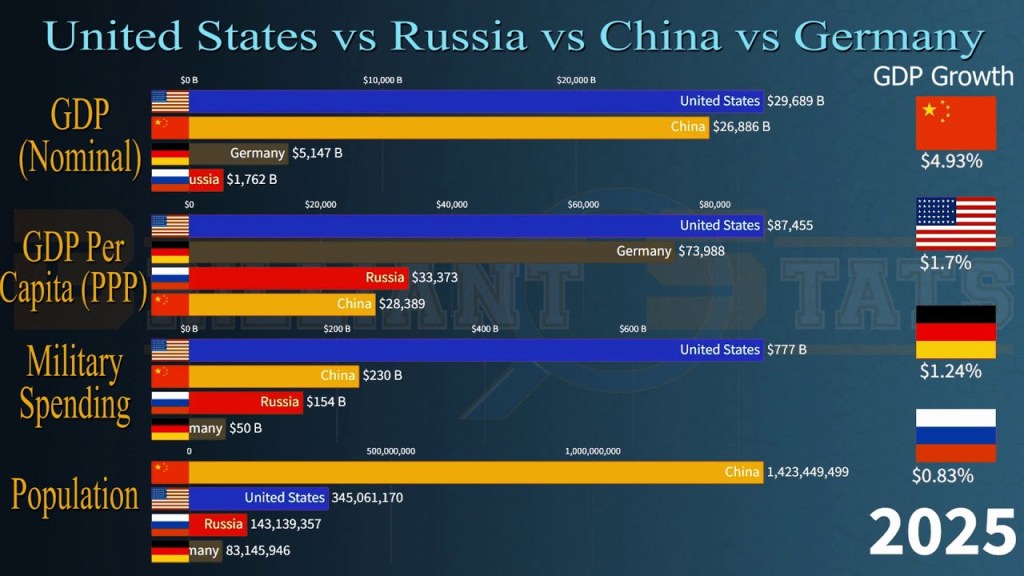
In 2019 these major powers according to GDP were ranked: 1. United States of America 2. China 3. Japan 4. Germany 5 India and 11. Russia.
In 2025, these same nations are ranked as: 1. United States of America (30.50 Trillion) 2. China (19.23 Trillion) 3. Germany (4.74 Trillion) 4. India (4.18 Trillion) 5 Japan (4.18 Trillion) and 11 Russia (2.07 Trillion).
‘It is notable that through much of their empire-colonial relationship between the United Kingdom and India, the colony had the larger GDP. This was the case from 1820 through 1900. This is principally due to the larger population of India. For example, in 1870, India’s GDP was one-third larger than that of the United Kingdom. In the same year, however, the UK GDP per capita was six times that of India.
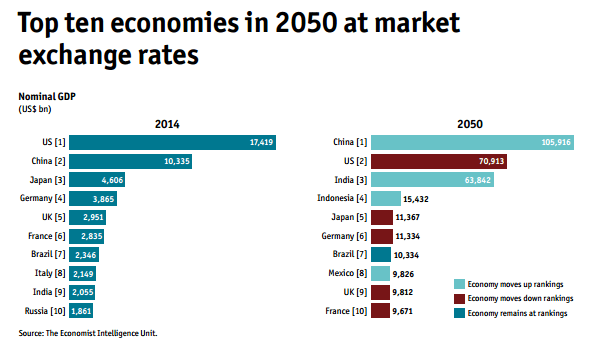
GDP projections produced for 2050, by… Price Waterhouse Coopers indicate that even more significant changes could be ahead. PWC expects China to have GDP of $61 trillion (US$2014). India is projected to be restored to its previous second place, at $42 trillion, just ahead of the United States ($41 trillion).
BRIICs members Indonesia [currently 17th] and Brazil [currently 10th] would be 4th and 5th, while BRIICs Russia would be 8th. Mexico [6th] and Japan [7th] would follow Brazil, with Nigeria [9th] and Germany [10th] rounding out the top ten. If PWC is right, the dominance of China and the United States might be supplanted by the historically dominant duo of China and India. Of course, no one knows for sure. Forecasting economics is even harder than forecasting population.’
The inclusion of Indonesia, Mexico, Russia and Nigeria in the top ten would come at the expense of the United Kingdom (6), France (7), Italy (8) and Canada (9) dropping out of the top ten largest economies in the world.
We learn some very salient points from this data.
First: Only China, India or the United States have ever been number one with regard to being the world’s biggest economy (GDP).
Second: It took nearly four hundred years [of a 500 year period], for a nation outside of Asia to catch up to China and India and then surpass them.
Third: China has fluctuated the most out of the major powers. It was marginally ahead of second place India for centuries, then in the 1800s gained a substantial lead and then by the 1900s was substantially behind India as well as other nations. Now, China has sensationally regained second spot.
Four: It is China which has witnessed the most dramatic economic reversal, being one-tenth the size of the United states in 1980 and within 30 years – a similar time frame we have now before us from 2022 to 2050 – moved from tenth to second in the world.
Five: The example comparing the former major power the United Kingdom and its former subservient colony India, exposes the active and dormant natures these powers respectively exhibited.
Six: Both Japan an island nation on the periphery of a continent the same as Great Britain and Germany, a young nation like Italy, have been major economic powers since the late 1800s and early 1900s and as with the United Kingdom, have shown a desire to follow an expansionist policy; creating military capability to match their economic prosperity and demonstrating the will to put it to use. They have all been active powers unlike the two major dormant powers, China and India. Some would argue credibly that China is now no longer dormant.
Seven: The predictions by PWC are enlightening and if correct, a circle is being completed with China and India regaining the lengthy historical positions of number one and two. Is the United States ascendancy on the wane, has it been an aberration of history. Will they dip forever, or only for a period, to resurface at number one again?
Eight: The key economic growth forecast, resulting in the improved standings for Indonesia, Brazil and Mexico, all corroborate what has been foretold. All three, have the wherewithal to achieve major power status and all will strengthen their military arsenals over ensuing decades (and centuries).
Nine: There is a glaring omission in the statistics, apart from the 2050 projection of Russia at number eight. Where has Russia been in this period? It has more often than not been in the top ten and in its guise as a modern empire – the Union of Soviet Socialist Republics – it was the second biggest economy in the world, consecutively from 1960 to 1985.
Ten: As only three nations have held number one and if the United States concedes to China, could another nation, a fourth nation, ever achieve number one spot and if so which one perchance?
Yes, a new nation will one day break into the club of three, exclusively held by China, India and the United States for the past five hundred years. Based on a number of observations and factors, that nation is… Russia.
Of course, many will smile at this and think this view simplistic and naive; based on inadequate information, limited knowledge and a shallow grasp of geo-economics and financial forecasts.
Russian Flag
The world has changed and the last century was very different from the four that preceded it. Was it far-fetched for China to move from tenth to second in the space of thirty years? No, it wasn’t. There is good cause to consider a similar scenario with Russia. It may not happen by 2050, but happen, it will.
This highlights important additional points, which tie Russia and Germany together.
While Japan experienced an imperialistic moment in history, much like Italy and Great Britain – which is remembered for its globe encircling empire that is undoubtedly the most famous in modern history, standing out in the annals of time, as does the Roman Empire of the past, which still impacts our civilisation – it is the militaristic nation of Germany, (whether one studies the two prime influences of the German people’s history: Austria in the south and Prussia in the north) with Russia, who possesses an even longer pedigree of imperialism, that are most likely to return to or further respectively, these inherent ambitions.
History is set to repeat itself.
At this point, Great Britain is not included in the rest of the discussion, for it has fallen from being a major power. The English people do not truly possess an imperialistic nature, nor the motive to maintain one; for the United Kingdom primarily pursued a defensive role in strategically maintaining an overseas empire built on colonialism for the purpose of trade.
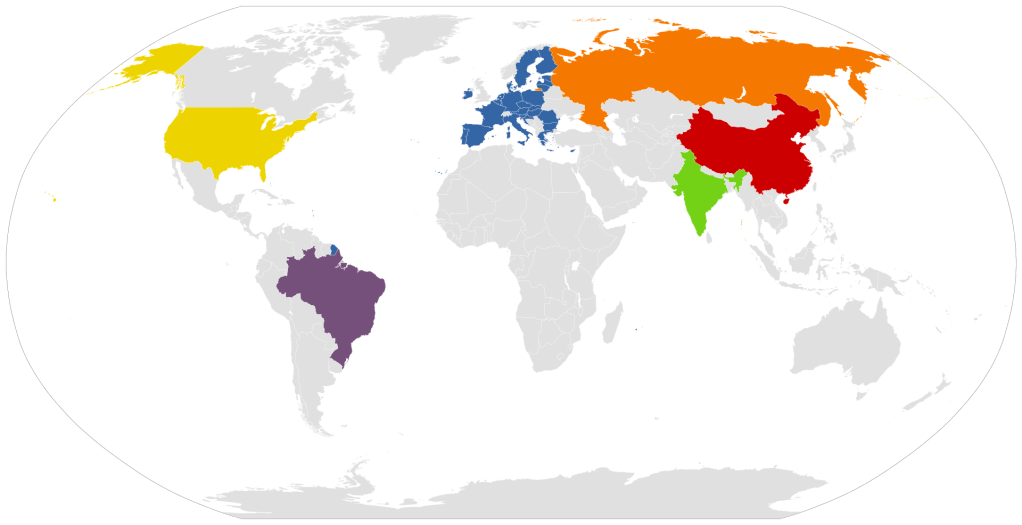
Map of the future predominant global economic-military powers
Comparing the six major powers today, both China and India if no longer dormant, remain relatively passive – particularly India. Saying that, both nations have the potential to become superpowers and this is very likely. Judging from modern history, it is a nation of formidable economic size which makes that quantum step from a major power to a super power.
For instance, Japan is a technological leader and economic giant. Some may think it could revert to a warlike footing, though this is not what is predicted; nor will Japan ever make the critical step to superpower status. It will likely remain a passive major power. In this regard, Germany as a major power, is similar to Japan. Two world wars revealed that Germany as a regional power took that next step to impact on a European regional scale; though it did not have the capability to extend itself beyond a certain parameter – a victim, of imperial overstretch. Of course, all that has changed now it is the economic driver of a new empire, currently called the European Union.
Flag of the European… German Union
Germany ultimately wields immense power. As a single nation, the leap to superpower status is beyond it. Not so with twenty-six nations in its close orbit and potentially many more to fall under its influence. For now, Germany is somewhere between a dormant and passive major power. In complete irony to the objective of “let’s contain and bind Germany in a unified Europe, so that it is shackled and unable to act aggressively ever again” – time will show it to be one of the worst decisions ever made in the history of our civilisation.
Russia’s ambitions in recapturing its lost satellite nations after the dissolving of the Soviet Union are palpable. Strategic buffer nations with vast natural resources such as Ukraine and Kazakstan are too valuable to ever relinquish permanent control; with Ukraine a case in point. All eyes have been glued on China for the past decade or two, though casting a wary eye on Russia would be more prudent.
It is Russia which was once a superpower and is not so far distantly removed in regaining that status. Its threat is real, not imagined and has not ever gone away. Russia is a constant active major power, with hundreds of years of successive imperialistic endeavours – the scourge of its neighbouring countries.
Russia – like the United States – has its proverbial ‘fingers in many pies’ with regard to geo-political interventions and associated intrigue. Admittedly, it was less overtly active between 1991 and 2014, though the signs of its stirring with the help of western provocation, are plain to see.
What lies ahead for these six major powers – with Japan as an exception, plausibly being reduced in stature and joined by the new and growing powers comprising Brazil, Mexico, Indonesia, Pakistan, Iran, Turkey and eventually a dramatic re-unification of Korea – is the transition to superpower status for China, India, a German led United States of Europe and the reinstatement of a resurrected Russian Empire. These four territories (GRIC) will eventually surpass the world’s only hyper power, the United States of America.
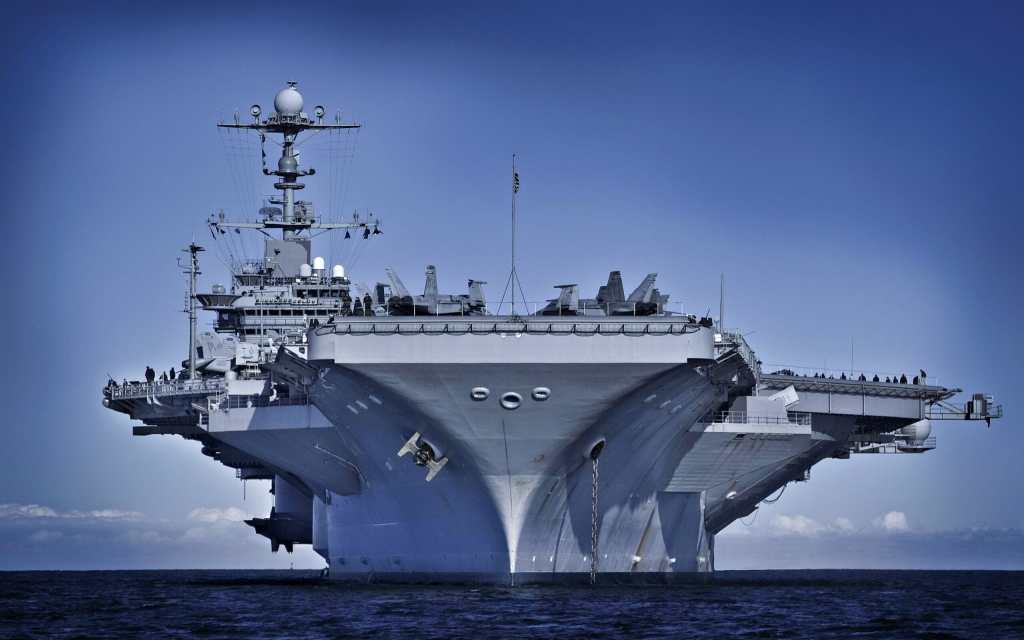
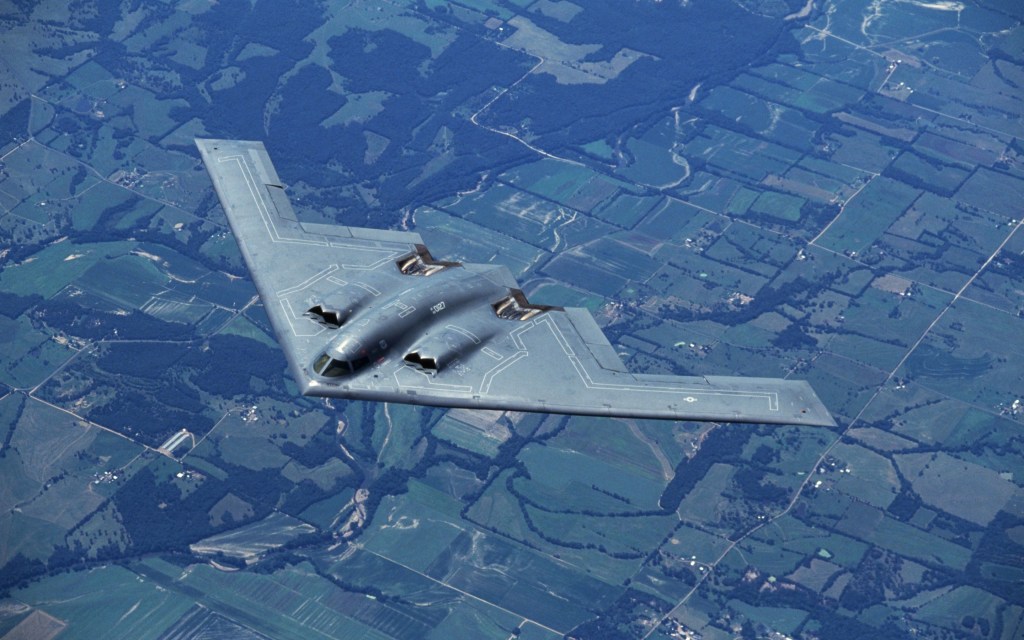
Potent symbols reminding of America’s military power – but for how much longer?
America is compellingly and utterly unique in all history, in the modern world and in our life times. No single nation has been so materially blessed or prosperous beyond belief. No country has so heavily influenced the rest of the whole world in its export of its culture through film, television, literature and music. Never, has a people so comprehensively dominated civilisation in its development of trade, information technology, media, telecommunications, popular culture, munitions, missiles and defence systems.
As an active superpower (and hyper power since 1991), the United States has undeniably built an empire unlike anything seen in the world, for though they do not have a mass of territorial conquests or colonies like the British Empire, their financial investment and diplomatic influence worldwide intertwines the global economy and its geo-political fabric like the roots of a tree that grow underground, wrapping themselves around everything in its path.
Yet, the United States of America reached its economic peak during the 1960s contributing approximately 40% of world GDP. Since then, it has decreased some 50% to approximately 20% or just over, in recent years. The United States took the mantle from the United Kingdom of world policeman and this is no coincidence; yet, as Great Britain suffered from imperial overstretch so too will America, with all its naval and military base presence worldwide coming at a huge cost – Chapter XXX Judah & Benjamin – the Regal Tribes. Eventually it will contract like all great empires have; experiencing an inevitable path of power shrinkage and the lessening of its global influence in every quarter; politically, militarily, economically and geographically – Chapter XXXIII Manasseh & Ephraim – the Birthright Tribes.
Its demise is predicted and it will be both swift and spectacular. A complete role reversal will occur involving its nemesis Russia, that will astound the world. Triggers for this will include other powers ‘ganging up’ on the United States, particularity from a trade stance. Historically, trade wars have led to military conflict. If such occurs, the United States will find itself out-numbered. There may even be a ‘third World War’ scenario. A NATO falling out could also go against the United States. Respect and confidence for the American dollar will continue to diminish and it will surely be replaced by another currency.
All this would impact the American domestic economy adversely; possibly leading to disenfranchised states seeking to secede from the Union; thereby fragmenting into individual states or groups of states as they seek their own independence from the federal government. Thus, seriously impacting America’s collective economic power, its global political influence and crucially, its military might.
In turn, this could be hastened in a Catch-22 by America’s increasing population; for the burgeoning, exponential growth rate of the Latino-Hispano demographic, coupled with the ever increasing African-American and Asian-American population, will lead to significant changes in American ideology, policy and purpose; shifting from the historic WASP dominance, further weakening America’s strength and resolve at home and abroad.
The result of America’s phenomenal prosperity, is a spoiled, arrogant and soulless nation that has well and truly begun its moral decline. For as author John Steinbeck said:
“If you want to destroy a nation, give it too much – make it greedy, miserable and sick.”
Coupled with this, the American civilisation’s eventual loss of wealth and riches will be when the majority of believers either cease to remember or honour the source of their opportunities, bounty and blessings; or when they are eventually outnumbered. For the United States, while not founded as a Christian or even a ‘religious’ nation, did provide through its Constitution, the freedom to worship in a manner that is entirely unique in the world.
When the United States finally arrives at its lowest ebb and becomes the Dis-united States of America; it’s wealth, purpose, resolve and pride in its own power will have dwindled to the point that it is a shadow of itself, a paper tiger. For many, this seems an impossibility or a state of affairs that would take centuries to achieve, but it would seem this may not be the case.
In tandem with America’s demise, will be the rise of the two preeminent European major powers, Russia and Germany. These two nations will form an alliance, that will reshape the global power structure and together the two superpowers will become the world’s hyper power, filling the vacuum left by the disintegrating United States.
This imagined future world view rather accurately reflects the amalgamation of Russia and a German led Europe; as well as the portrayal of the geo-economic trading blocs of North America, Latin America, Africa, the complex Islamic sphere and the enlarged East Asian region.
It is to Russia that America will one day turn, cap in hand. The eventual outcome is not good, as the independent American polarities will be defeated by a coalition, constituting the northern alliance of Russia and Germany (Europe); in turn collaborating with a Brazilian and Mexican led Latin America.
In this new world order, the Islamic nations as discussed earlier, possibly led by a reincarnation of the Ottoman Turks, Turkey; will challenge the northern alliance hegemony. In a war that stages three major conflagrations, with the North winning the decisive third battle, the southern confederacy of Islam falls to the subjugation and occupation of Russia and a German led Europe. India too, a bystander – or ally of the southern confederacy – will also fall prey to Russian and German domination.
Aside from the intriguing date, the rendition of this world view prescribes the lands – North Africa, the Middle East, as well as India – which will ultimately fall into the hands of a Russian and German alliance. The artwork hinting of an ancient Roman resurrection coupled with Jewish hegemony is uncannily close to the mark.
At this point the Eastern hordes, comprising China and its allies, decide ‘enough is enough’ and face off against the northern alliance in the mother of all battles that is actually predicted by name. What happens next, is the subject for a different question and another time…
“There is nothing new in the world except the history you do not know.”
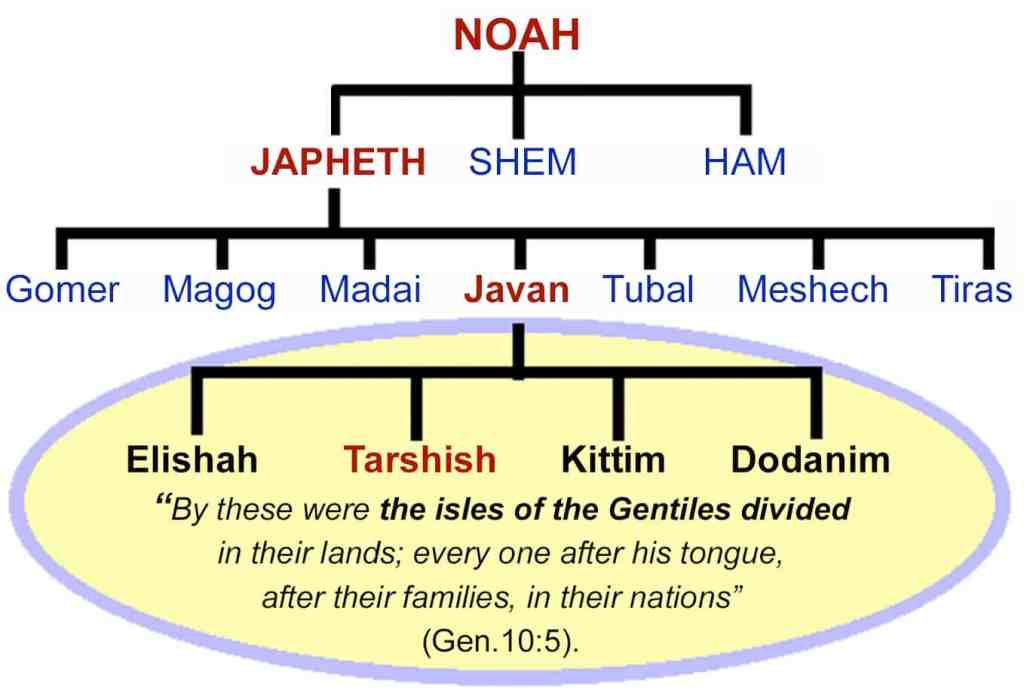
Javan’s second son Tarshish, figures prominently in the Bible. He lived the furthest of all his brothers; somewhat similar to Togarmah separating from Gomer’s other sons – Chapter VI Togarmah & the Koreas.
Tarshish grew wealthy through trade and is synonymous with shipping. Of all the eastern peoples, Tarshish had a strong orientation to the West, enduring until the present day. There is only one candidate remaining in East Asia who could fulfil Tarshish’s inherited identity as a maritime island nation descended from Javan.
The people descended from Tarshish today, comprise the people of Japan.
The Origin of the Nations, Herman Hoeh, 1957:
‘Tarshish first settled in Asia Minor. The city of Tarsus was named after him. Here… Paul was born. From Tarsus the tribe spread into Spain and northern Portugal, founding the famous port of Tartessus – the Tarshish of the Old Testament history of Solomon’s time…’
During Solomon’s reign from 970 to 930 BCE, the people of Tartessus were Phoenicians and not the descendants of Tarshish who founded the city. The following regions are attributed to Tarshish and are all plausible cities and ports established during trading expeditions and migrations in the ancient past, as we have formerly noted with Kittim in the Mediterranean – refer Chapter VIII Kittim & Indonesia.
The Targum of Jonathan renders Tarshish as Carthage in north Africa, though a biblical commentator Samuel Bochart, read it as Tartessos in ancient Hispania on the Iberian Peninsula, near Huelva and Sevilla today. Jewish scholar, Isaac Abarbanel, described Tarshish as ‘the city known in earlier times as Carthage and today called Tunis.’ An earlier identification had been with the inland town of Tarsus in Cilicia of south-central Turkey. American scholars William Albright and Frank Cross suggested Tarshish was located in Sardinia because of the discovery of the Nora Stone, whose Phoenician inscription mentions Tarshish.
Nineteenth century commentators proposed Tarshish was fulfilled in Britain, including proponent Alfred Dunkin. This idea stemmed from the fact that Tarshish is recorded to have been a trader in tin, silver, gold and lead which had all been mined in Cornwall. Britain is still reputed to be the ‘Merchants of Tarshish’ today by some Christian believers; which is weighted with irony, due to the many points of similarity between Japan and Britain.
Much could be written on the fascinating inter-relatedness of Japan and Great Britain – Island nations on the periphery of continents; part of yet separate, from their neighbours geographically and ideologically; strong self-identity; cultural icons; empires; military and economic powers; sea-faring and maritime states; ship builders; inventors; traders… world influencers – Article: 2050.
Japan, Its Biblical Past and Future, Bob Thiel, 2007:
‘… within Church of God circles [some] have… speculated that the Japanese may have descended from Ashkenaz [Vietnam], a son of Gomer (Generations of Japheth. Church of God News… 1965) or Togarmah [North Korea and South Korea], another of Gomer’s [sons]; the… Plain Truth magazine stated, “Japan is Tarshish of Asia in Bible prophecy” (Plache R F, Lexander G L. Japan’s New Role in Asia. Plain Truth, April 1968, page 27).
Steven M Collins in his book, The Lost Ten Tribes of Israel… Found! 1992, proposes three explanations on the biblical Tarshish – emphasis mine:
‘The King James Version of the Bible records in I Kings 10:22 that King Solomon “had at sea a navy of Tharshish” (other versions simply say “Tarshish”). One possibility is that Solomon had a fleet of ships based in Spain because Tartessus (in ancient Spain) is often identified as “Tarshish”… “ships of Tarshish” were recorded as having made voyages to the New World… It is also significant to note that I Kings 10:22 is the Bible’s first mention of “ships of Tarshish.” I Kings 10:22 may be a reference to a Phoenician/Israelite colony in Spain which became the homeport of a major… fleet during Solomon’s reign. If so, Tartessus (or Tarshish) was a jumping-off point for voyages throughout the Atlantic… [and] that a reference to “ships of Tarshish” identified the fleet that Israel (together with Tyre and Sidon) had based in ancient Spain.
The second explanation considers the possibility that the extra “h” in the word Tharshish identifies this navy with one of the clans of the Israelite tribe of Benjamin, which was named “Tharshish” (I Chronicles 7:10). Since “Tharshish” is an Israelite name, the Bible’s reference to “ships of Tharshish” could mean that this navy was primarily crewed by members of this branch of the tribe of Benjamin. It is also possible that the term “ships of Tarshish” later came to describe a particular class of seagoing vessels used by the Phoenicians. This possibility is supported by the reference in I Kings 22:48 that over a century later Judah’s King Jehoshaphat tried to “make” a fleet composed of “ships of Tarshish” for basing in the Red Sea port of Eziongeber.’
This is an insightful observation, as we will learn that modern day Benjamin does indeed have a strong ship building legacy – refer Chapter XXX Judah & Benjamin – the Regal Tribes.
Collins:
‘Some readers might wonder whether the “ships of Tarshish” belonged to the Japhethic tribe of Tarshish mentioned in Genesis 10:4. While that would seem to be a possibility at first, the fact that the Tartessian “Tarshish” was located in the direction that Jonah sailed to Tarshish, and the fact that the Iberian “Tarshish” spoke a dialect of Phoenician (a Semitic language) argues for a Semitic origin for Solomon’s “ships of Tharshish” and the Iberian “Tarshish.”
Furthermore, there is no biblical evidence of any close cooperation between King Solomon’s Israelites and the Japhethic nation of Tarshish. Since Barry Fell’s book, America B.C. gives evidence of “the ships of Tarshish” being involved in ancient explorations of North America, this also argues that the biblical “Tarshish” was located proximate to the Atlantic Ocean (such as in ancient Spain).’
Tarshish may well be the city port, located in Spain.
Mount Fuji is an active stratovolcano located on the Japanese Island of Honshu; though has been dormant since its last eruption in 1707. Mount Fuji is located about 60 miles (100 km) west of the Tokyo-Yokohama metropolitan area. The volcano has a summit elevation of 3,776.24 m (12,389 ft 3 in) and is the highest mountain in Japan, as well as being the second-highest volcano on any Asian Island after Indonesia.
Recall, we learned with Kittim in the preceding chapter, that the verse in Daniel detailing a naval fleet setting sail from Kittim is not a reference to the West, or to Rome, or even Italy, but as the verse states, it is a direct reference to Kittim the descendants of Javan. Albeit, it is a future prophecy. The difference here, is that the ‘ships of Tarshish’ are detailing a current event; though it is the ships of Tarshish stated, not Tarshish the port. With that in mind, there are verses which record a round trip to Tarshish being considerably further than merely from Canaan to Spain.
Bochart suggested eastern localities for the ports of Ophir and Tarshish during King Solomon’s reign, specifically the Tamilakkam continent: present day Southern India* and Northern Ceylon** (now Sri Lanka), where the Dravidians were famous for their gold, pearls, ivory and peacock trade.
1 Kings 10:22
English Standard Version
‘For the king [Solomon] had a fleet of ships of Tarshish at sea with the fleet of Hiram [the Phoenician]. Once every three years the fleet of ships of Tarshish used to come bringing gold, silver, ivory, apes, and peacocks.’
Contrary to Collins dismissing a relationship with Tarshish the nation, this verse may well be supporting an economic arrangement with the Tarshish of the East – rather than the city-port, of the western Mediterranean. If the visits were this infrequent, it supports Tarshish was all the way around the Earth, either in Japan or East Asia – some 5,656 miles from the Israelite Kingdom – and their ships were collecting exotic items throughout Southeast Asia and India en route. See 2 Chronicles 9:21, 1 Kings 22:48 and 2 Chronicles 20-36-37.
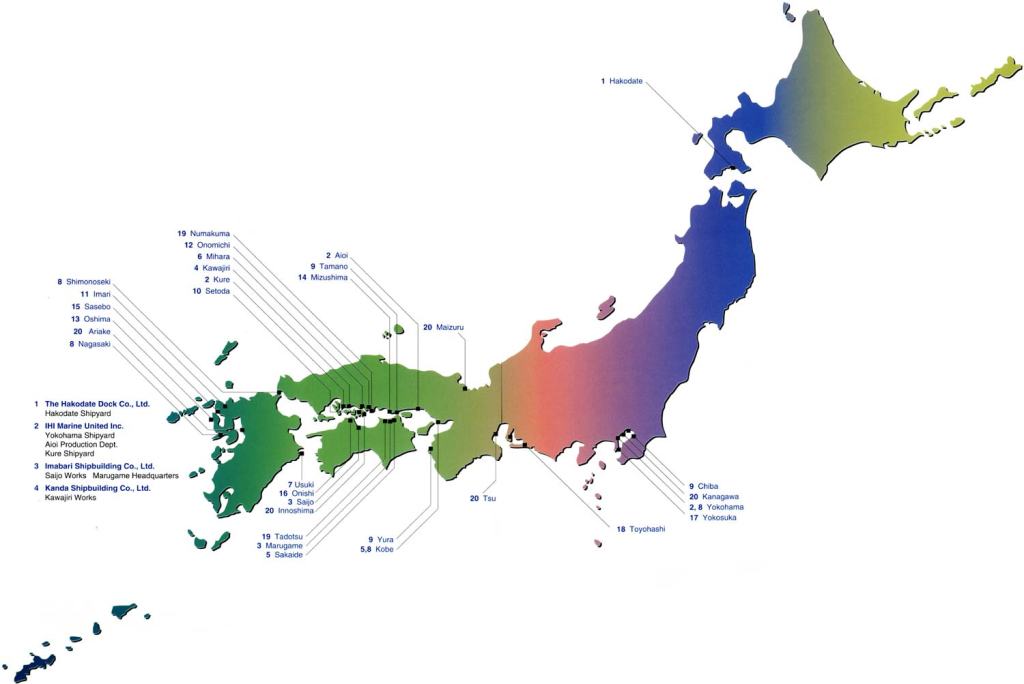
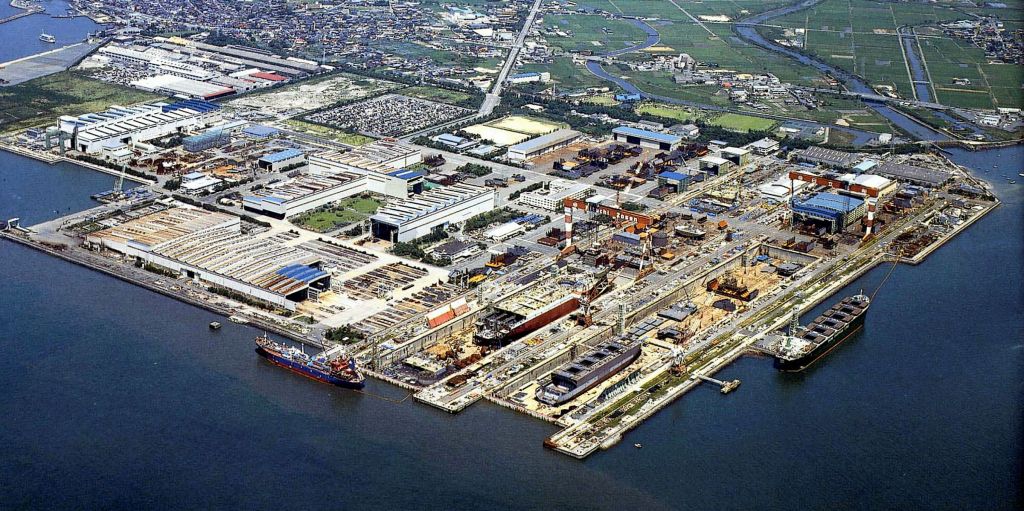
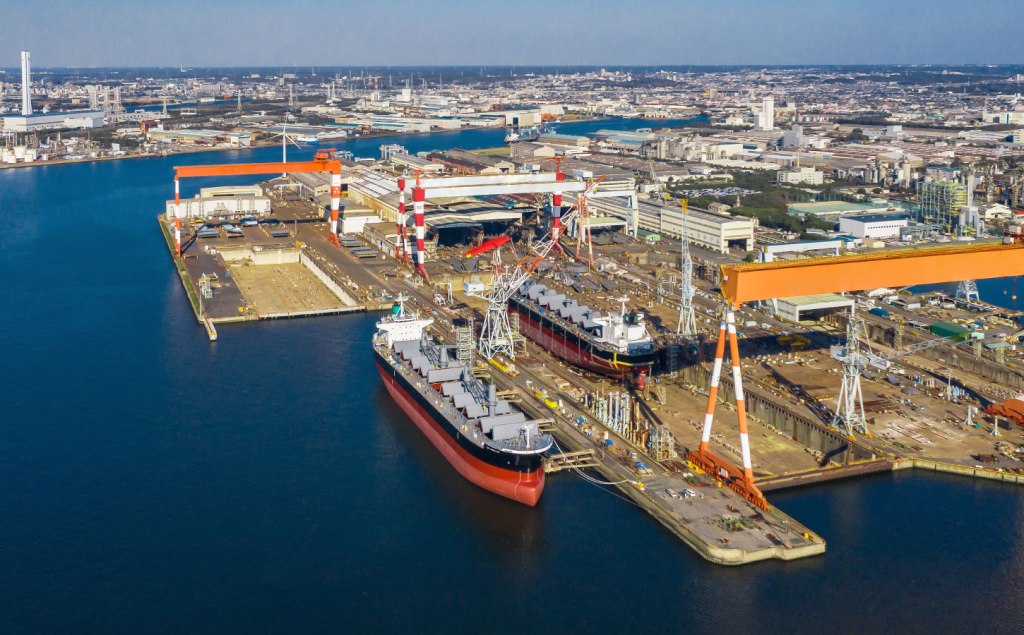
Ship building sites in Japan
Psalm 72:10
New Century Version
‘Let the kings of Tarshish and the faraway lands bring him [King Solomon] gifts. Let the kings of Sheba and Seba [a grandson (India*) and a son of Cush (Sri Lanka**) respectively] bring their presents to him.’
Jeremiah 10:9
English Standard Version
‘Beaten silver is brought from Tarshish, and gold from Uphaz. They are the work of the craftsman and of the hands of the goldsmith; their clothing is violet and purple; they are all the work of skilled men.’
The Japanese are a highly skilled people with an economy reflecting their talent, work ethic, technological prowess and subsequent wealth.
The reference to violet and particularly purple, lends itself to either the Phoenicians – refer Chapter XII Canaan & Africa – or it is exemplifying the quality of the workmanship, the products and the fitness for royalty, such as for King Solomon himself. Either way, it cannot be ignored, that Tarshish was linked to ‘faraway’ lands – refer Chapter VII Javan: Archipelago South East Asia & Polynesia – and with ‘Sheba and Seba’ of Cush – refer Chapter XIII India & Pakistan: Cush & Phut.
Both associations are clues to Tarshish being located a great distance away, as in Asia and not the western Mediterranean.
Ezekiel 27:12, 25
English Standard Version
‘Tarshish did business with you because of your great wealth of every kind; silver, iron, tin, and lead they exchanged for your wares… The ships of Tarshish traveled for you [Tyre] with your merchandise. So you were filled and heavily laden in the heart of the seas.’
Japan in the Bible, Peter Salemi:
‘In sixteenth-century Japan, the production of gold and particularly silver grew so significantly that it left a mark on world economic history. Indeed, Japan may have accounted for as much as one-third of the world’s silver output at the end of the sixteenth century and beginning of the seventeenth century’ – Kozo Yamamura, editor, The Cambridge History of Japan, pages 60-61.
‘The warlords of this period encouraged gold and silver mining as a source of funds, leading to the discovery and development of many more mines. Most of the daimyos held large stocks of gold and silver bullion and gold dust. Nobunaga, (1534-82, the ‘Japanese Attila’), and Hideyoshi (1535-98, a brilliant commander and statesman), both had great reserves of bullion collected in their castles and used gold freely and ostentatiously to impress the world with their magnificence’ – George Sansom, AHistory of Japan1334-1615, pages 339-340.
Isaiah 23:1, 6, 10, 14
English Standard Version
‘The oracle concerning [the fall of] Tyre.
Wail, O ships of Tarshish, for Tyre [Brazil] is laid waste, without house or harbor! From the land of Kittim [Indonesia] it is revealed to them… Cross over to Tarshish [Japan]; wail, O inhabitants of the coast! Cross over your land like the Nile, O daughter of Tarshish; there is no restraint anymore… Wail, O ships of Tarshish, for your stronghold is laid waste.’
The fall of Tyre – a key trading partner – impacts both East Asia and Southeast Asia. Notice Tarshish and Kittim, two brothers in the far East, are linked together. This is not referring to a Phoenician port in the Mediterranean.
Isaiah 66:19
English Standard Version
‘… and I will set a sign among them. And from them I will send survivors to the nations, to Tarshish, Pul, and Lud [fourth son of Shem], who draw the bow, to Tubal [fifth son of Japheth] and Javan, to the coastlands far away [archipelago Southeast Asia: Indonesia, Malaysia and the Philippines], that have not heard my fame or seen my glory [non-Christian countries]. And they shall declare my glory among the nations.’
Ezekiel 38:13
New English Translation
‘Sheba and Dedan [grandsons of Cush] and the traders of Tarshish with all its young warriors [Hebrew: lions, the East Asian ‘Tiger Economies’] will say to you, “Have you come to loot? Have you assembled your armies to plunder, to carry away silver and gold, to take away cattle and goods, to haul away a great amount of spoils?”
Tarshish, an economic and military power with Cush, stands against the great future military alliance comprising Magog, Meshech, Tubal and Gomer – which includes China and the continental Southeast Asian nations of Vietnam, Thailand, Myanmar, Cambodia and Laos, with Togarmah, a re-united Korea – and does not join with them.
Jonah 1:1-3
New English Translation
‘The Lord’s message came to Jonah son of Amittai, “Go immediately to Nineveh, that large [Hebrew – gadol: great, populous, mighty, powerful, fierce] capital city, and announce judgment against its people because their wickedness has come to my attention.”
Instead, Jonah immediately headed off to Tarshish to escape the commission from the Lord. He traveled to Joppa and found a merchant ship heading to Tarshish. So he paid the fare and went aboard it to go with them to Tarshish, far away from the Lord.’
Jonah understandably, was not keen to go to Nineveh in northern Mesopotamia, the very capital of the mighty Assyrian Empire. The equivalent assignment today would be travelling to Russia and preaching a message of sin and repentance to the Russian people in Moscow… daunting indeed – Chapter XX Will the Real Assyria Stand Up: Asshur & Russia.
There is a humorous element to Jonah boarding a vessel that would not just take him away, but take him to the furthest reaches logistically possible. The furthest destination was Tarshish.
Similarly, for most people today, travelling to Japan would be going to the ends of the earth. Japan is so far east, it is in the West so-to-speak. Tarshish can be understood to be in the far west, depending on which direction one is heading. For example, viewed from the United States – Isaiah 2:16; 60:9.
Psalm 48:7
Common English Bible
‘… or like the east wind [from the Pacific] when it smashes the ships of Tarshish [Japan].’
The meaning of Tarshish has a number of interesting aspects and permutations.
Exodus 28:20
King James Version
‘And the fourth row a beryl [H8658 – tarshiysh: a precious stone or gem], and an onyx, and a jasper: they shall be set in gold in their in closings.’
The Hebrew term tarshish is a homonym, occurring seven times in the Bible and translated beryl in older English versions. It is also the name of a gem stone associated with the Tribe of Asher, which has been identified by the Septuagint and by Josephus as the ‘gold stone’ possibly linked to the chrysolite – a gold, yellow colour – or yellow jasper.
Well known varieties of beryl include emerald and aquamarine. The meaning of Beryl in Sanskrit is a ‘light green semi-precious gemstone’ and in Italian, ‘blue green from the sea.’ It is often colourless* or translucent, though impurities give it colours ranging from green to blue, yellow, red (the rarest) and even black. It is the first stone on the fourth row of the priestly breastplate – Exodus 28:20. Refer also, Ezekiel 1:16 and Daniel 10:6.
Tarshish in Hebrew means: ‘his Excellency’ and ‘breaking, subjection’.
The connotation includes a ‘white dove’ or being ‘dove-white’ and a ‘search for alabaster’.
The verb rashash means to ‘beat down, shatter’, the noun shayish ‘white alabaster’, the noun tor, ‘dove’.
Tarshish has a similar definition as Riphath, Togarmah and Kittim in the element of either ‘beating or breaking.’ This shows their familial ties and perhaps somewhat of a future warning – particularly for the first three.
Abarim Publications – emphasis mine:
‘The name Tarshish (or Tharshish according to some translations) is assigned five times in the Bible: The first Tarshish is a son of Javan son of Japheth, son of Noah (Genesis 10:4). This name is spelled (Tarshishah) in 1 Chronicles 1:7, but the -ah ending may in fact stem from a locative suffix that means toward or unto, so that it could refer to the range of the sons of Javan: all the way to Tarshish.
Most famous is Tarshish the city famed for its wealth and merchant fleet… but which location is unknown…
A Benjaminite (1 Chronicles 7:10).
One of seven Persian princes (Esther 1:14). Note that the name of one of two aspiring assassins of king Ahasuerus, namely Teresh (Esther 2:21), seems like a truncated version of Tarshish. And both may have something to do with the Persian governmental title tirshatha, usually translated with “governor” (Ezra 2:63, Nehemiah 7:65).
The Hebrew name of a certain precious stone (perhaps yellow jasper, says BDB Theological Dictionary, but translated chrysolite by NIV and beryl by NAS) is also tarshish…
These names (and noun) Tarshish come from different languages and have different etymologies. The Persian prince was probably known as Tarshata, meaning His Excellency (says BDB Theological Dictionary). Another suggestion is a relation to the word tarsta, meaning the feared or revered (BDB Theological Dictionary).
… Jones translates the name Tarshish with Breaking or Subjection, and the prefix taw would denote a thorough destruction or an ongoing one. But although Tarshish is mentioned here and there as subject of God’s wrath (Psalm 48:7, Isaiah 2:16, 23:1), it is mostly known for its great success in the economic arena.
Isaiah even predicts that Tarshish is not going to be simply destroyed, as were Sodom and Gomorrah, but that its legacy will one day be employed to service God (Isaiah 60:9). It is unlikely that the name Tarshish is supposed to be linked to a verb that denotes defeat and destruction. Note that the shish-part of the name Tarshish looks a lot like the word (shayish), meaning alabaster amostly translucent or white crystal:
The beryl stone is transparent* in its purest form, though it can also amongst all the other colours stated, be white.
‘There’s an odd correlation between the color white and the number six. The nouns… shesh… and… shayish… mean alabaster, which is a whitish translucent material. The identical word… shesh… means six.
The noun…shushan… describes the lily, which has six leaves and is… white.’
The Japanese have a propensity in using flowers as symbols.
‘The adjective… yashesh… means old or white haired. The verb… tur… means to explore or survey and associates with a broad, circular or sweeping motion. Noun… tor… appears to describe a circular braid of hair.’
On a personal note, I am reminded of the cherry blossom emblem – used by the Japanese national rugby team. One of my vivid memories after being fortunate to visit Tokyo in 1989, was all the beautiful white – and not to forget pink – tree blossom.
The ‘circular braid’ is reminiscent of ancient Samurai warriors and modern Sumo wrestlers, with their long braided hair. The related Polynesians from Javan and also the Amerindians from Tiras, wore their hair in a similar fashion.
Japan comprises an amazing archipelago of 6,852 islands covering 145,937 square miles. The country’s four main islands from north to south, are Hokkaido, Honshu, Shikoku and Kyushu.
Tokyo is situated on Honshu and is both the capital and largest city.
Other major cities include Yokohama, Osaka, Nagoya, Sapporo, Fukuoka, Kobe and Kyoto. Japan is the 12th most populous country in the world, as well as one of the most densely populated and urbanised. About three quarters of the country’s terrain is mountainous, concentrating its population of 122,783,364 people on narrow coastal plains.
The Greater Tokyo area has approximately forty-one million residents (as of 2024) – the most populous metropolitan area, or mega-city in the world.
The first mention of the archipelago appear in Chinese chronicles from the first century CE. Between the fourth and ninth centuries, the kingdoms of Japan were unified under an emperor and beginning in the twelfth century political power was held by a series of military dictators, the Shoguns and feudal lords, known as Daimyo; each enforced by a class of warrior nobility, the Samurai.
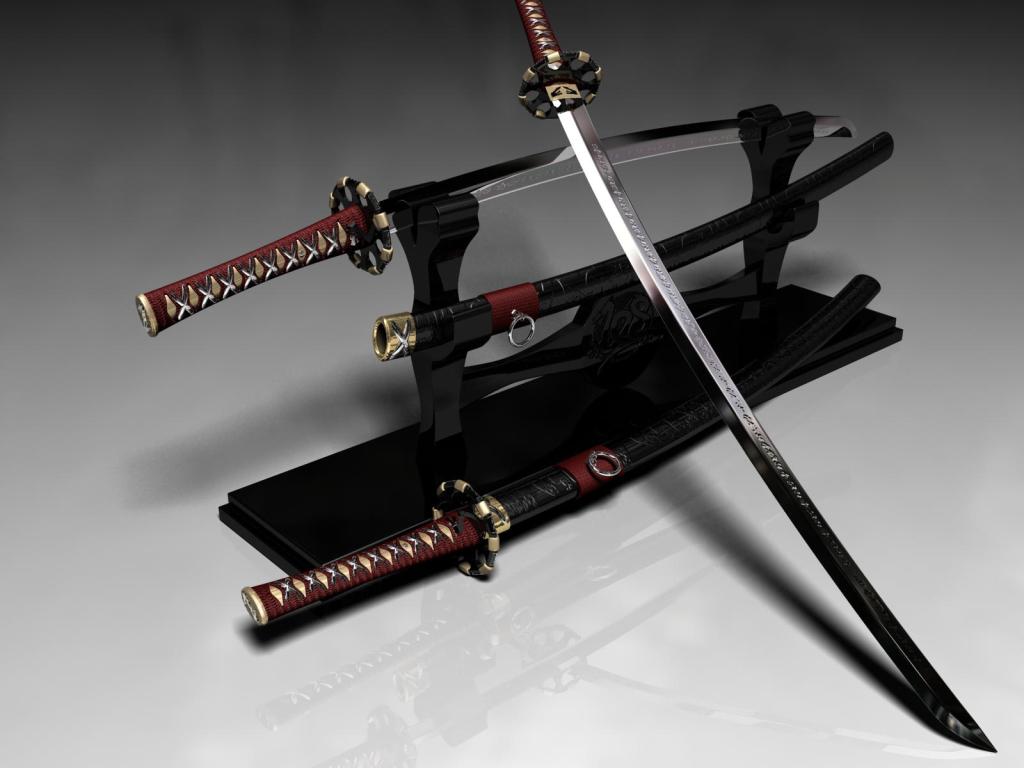
The adoption of modern firearms rendered the traditional weapons of the Samurai obsolete. The most notable being the katana (‘one-sided blade’); a Japanese sword characterised by a ‘curved, single-edged blade with a circular or squared guard and long grip to accommodate two hands.’
A century long period of civil war ended in reunification in 1603 under the Tokugawa Shogunat.
A lengthy isolationist foreign policy was then enacted until 1854, when a United States fleet forced Japan to open trade – the awakening and emergence of the great trading nation of Tarshish – to the West, which led to the end of the shogunate and the restoration of imperial power in 1868. Japan adopted a Western styled constitution and pursued a program of industrialisation and modernisation.
Prisoners of Geography, Tim Marshall, 2016 & 2019, page 235:
‘By the beginning of the twentieth century Japan was an industrial power with the third-largest navy in the world, and in 1905 it defeated the Russians in a war fought on land and sea. However, the very same island-nation geography that had allowed it to remain isolated was now giving it no choice but to engage with the world. The problem was that it chose to engage militarily.
Both the First Sino-Japanese War and the Russo-Japanese War were fought to thwart Chinese and Russian influence in Korea. Japan considered Korea to be, in the words of its Prussian military advisor, Major Klemens Meckel, ‘A dagger pointed at the heart of Japan’. Controlling the Peninsula removed the threat, and controlling Manchuria made sure the hand of China, and to a lesser extent Russia, could not get near the dagger’s handle.’
In 1937, Japan invaded China and by 1941 it had entered World War II as an Axis power. After suffering defeat in the Pacific theatre of war, Japan surrendered in 1945. After World War II, Japan experienced impressive economic growth – boosted by American investment and loans – becoming the second largest economy in the world by 1990, before being surpassed by China in 2010. A leader in the automotive and electronics industries, Japan has made considerable contributions to science and technology.
Japan is a great power and maintains Self-Defence Forces which rank as the world’s 4th most powerful military. During the 1980s, political pundits and economic analysts predicted Japan achieving superpower status; due to its population, GDP and economic growth. It was thought, as with China today that Japan would eventually surpass the economy of the United States.
Japan is considered a cultural superpower in terms of its large-scale influence in food, ‘electronics, automobiles, music, video games and anime.’ Japan has faced an ongoing period of stagnation since the 1990s, an ageing population since the early 2000s and serious population decline beginning in 2011, all of which has eroded its potential as a superpower.
Japan’s name in Japanese is written using ‘the kanji 日本 and pronounced Nippon or Nihon’ and was adopted in the early 8th century. Prior to this, the country was known ‘in China as Wa (倭) and in Japan by the endonym Yamato.’ The characters 日本 mean a ‘sun origin’, which is in reference to Japan’s far eastern location and the source of the western epithet ‘Land of the Rising Sun.’
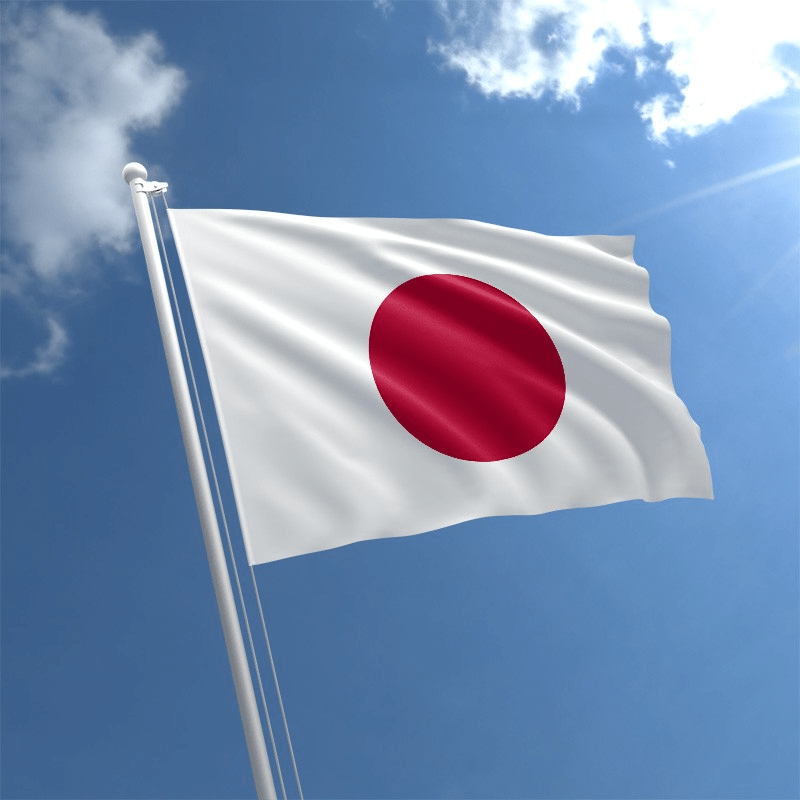
The official name of the Japanese flag is Nisshoki, which means the ‘sun-mark flag’, though most people call it Hinomaru, meaning ‘circle of the sun’, for the circle in the centre of the flag represents the sun. The flag of Japan isn’t white and red, it is actually white and crimson. The first documented use of the flag of Japan was in 701 CE and was mentioned in the Shoku Nihongi, ‘a classical Japanese history text, which credited Emperor Mommu with the flag’s use.’
The name Japan is based on Chinese pronunciation and was introduced to European languages through trade. In the 13th century, Marco Polo recorded the early Mandarin or Wu Chinese pronunciation as Cipangu.
Japanese Flag (above) and Naval Ensign (below)
The old Malay name for Japan, Japang or Japun, was borrowed from a southern coastal Chinese dialect and encountered by Portuguese traders in Southeast Asia, who brought the word to Europe in the early 16th century.
The first version of the name in English appeared in a book published in 1577, which spelled the name as Giapan in a translation of a 1565 Portuguese letter.
An interesting coincidental similarity exists between the English word, Jap-an with the biblical name of their forefather, Jap-heth.
Would this not be an extraordinary coincidence indeed if Japheth were the ancestor of Europeans as promulgated by the majority of teachers – refer Chapter II Japheth Orientalium.
Yet, if Japheth is actually the paternal ancestor of the peoples in East Asia, South East Asia, Central Asia, Polynesia and the indigenous Native Americans after all, then it would be more than a mere coincidence.
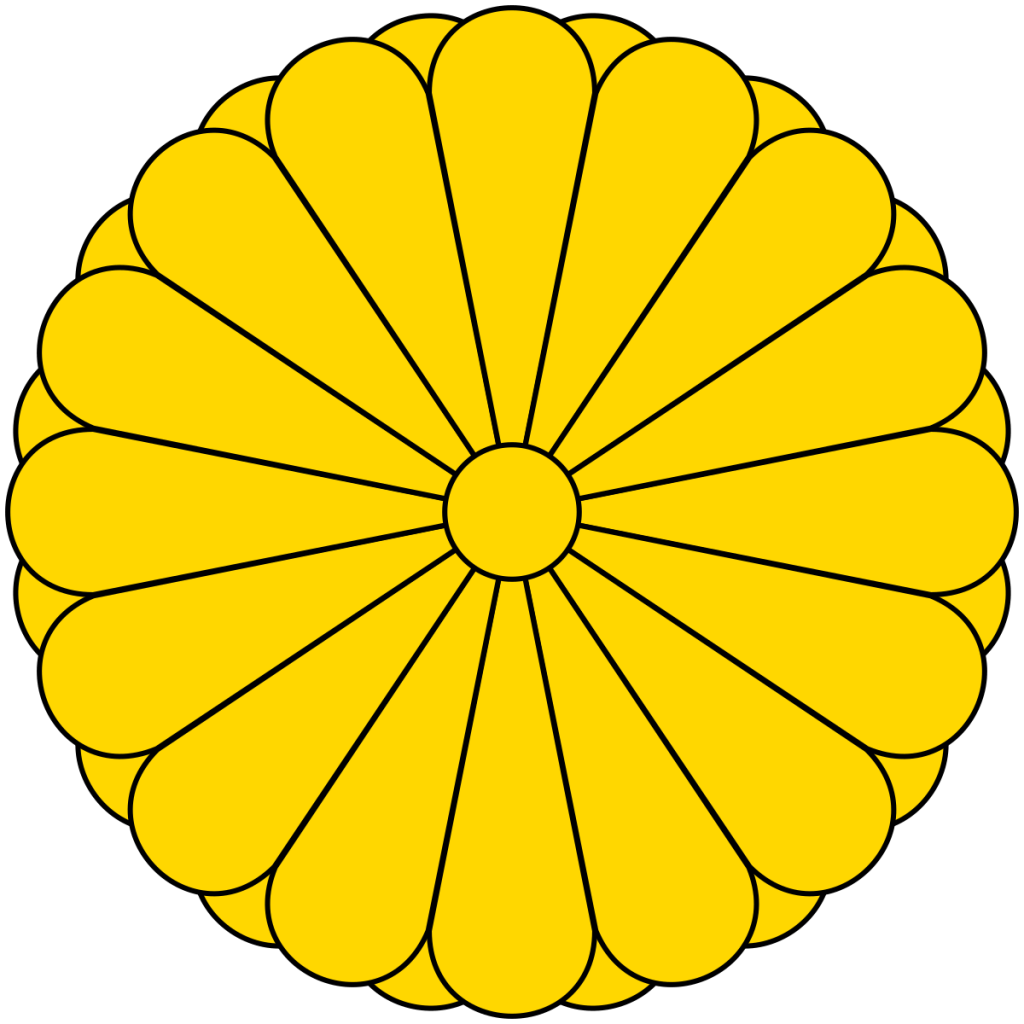
The Japanese coat of arms is commonly represented by the imperial crest, known as the chrysanthemum crest (kikumon), which features a stylised sixteen (flower) petal chrysanthemum.
Japan leads the world in robotics production and use; supplying approximately 55% of the world’s total. The Japanese consumer electronics industry once the strongest in the world, now faces stiff competition from South Korea, the United States and China. Japan remains a major leader in the video gaming industry, with the United States.
On the index of most technological nations in the world, Japan is number one. Japanese scientists have made enormous contributions in the following fields: automobiles, electronics, machinery, earthquake engineering, optics, industrial robotics, metals and semi-conductors. Japanese researchers have won numerous Noble Prizes in recognition for their superior contribution in technological pursuits.
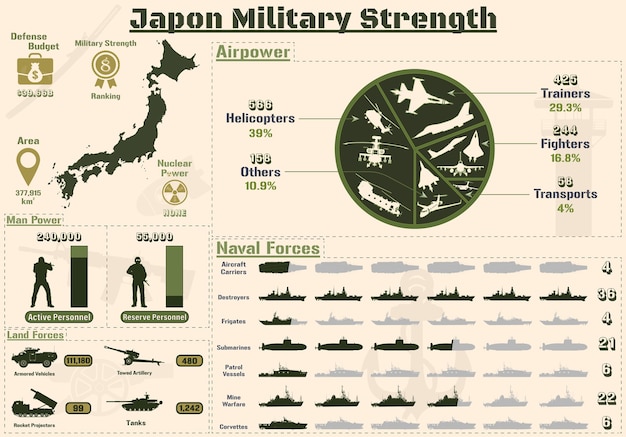
Japan is the fifth largest economy in the world; with a GDP of $4.18 trillion in 2025.
Effective co-operation between government and industry, coupled with advanced technological know-how have built Japan’s manufacturing and export-oriented economy. Japan is low in natural resources and dependent on energy imports, particularly after the 2011 Fukushima disaster and a general shutdown of its nuclear power industry.
‘The following export product groups categorize the highest dollar value in Japanese global shipments during 2024.
Vehicles: US$150.8 billion
Machinery including computers: $125.7 billion
Electrical machinery, equipment: $101.1 billion
Optical, technical, medical apparatus: $36.2 billion
Iron, steel: $27.4 billion
Plastics, plastic articles: $24.7 billion
Gems, precious metals: $23 billion
Organic chemicals: $14.3 billion
Copper: $13.4 billion
Other chemical goods: $13.2 billion
Gems and precious metals represent the fastest grower among the top 10 export categories, up by 23.9% since 2023. In second place for improving export sales was copper which was up by 6.9%. The leading decliner among Japan’s top 10 export categories were the metals iron and steel, which fell -10.4%.’
In 2020, Ships and boats at $10.8 billion was listed at number ten.
Japan is a member of the prestigious intergovernmental G7 Group of nations. These are the major industrialised nations, who drive the world economy, monetary issues and policy. Japan’s inclusion is significant as it is the only descendant of Japheth and the only nation from East Asia or outside the European and North American spheres.
Major nations not included are Russia (11th) due to its expulsion from the G8 in 2014 because of its annexation of the Ukraine and the Crimea; as well as the less developed major economies of China (2nd), India (5th) and Brazil (9th).
The other nations in the G7 include: the United States of America (1), Germany (4), the United Kingdom (6), France (7), Italy (8) and Canada (10).
Japan in the Bible, Peter Salemi – emphasis mine:
‘It appears that the sons of Tarshish originally settled in southern Asia Minor, giving their name to the city of Tarsus. The traditions of ancient Japan claim its people were led to the “Land of the Rising Sun” by a three legged crow – the “sun crow” representing the sun deity in the ancient Far East. Surprisingly, the rare imagery of three-legged birds as sun symbols has also been found on coins of Asia Minor, where sat Tarsus.
Yatagarasu – legend of the three legged crow
A.L. Sadler, a professor of Oriental Studies at the University of Sydney, wrote in his 1946 book A Short History of Japan:
“… Some Japanese ethnologists favour the theory that the Yamato came from Central Asia” (pp. xi-xii).’
Support for this premise is the paternal Y-DNA Haplogroup D, which is prevalent in just two countries: Tibet and Japan.
Salemi:
‘The peoples of Persia called those descended from Javan in Asia Minor, Yuna or Yuana (Rapson 1914: 86).
Tarshish migrated with Kittim’ – Chapter VIII Kittim & Indonesia.
‘They stayed with Kittim [Khitan?] for a time in northern China. The Chinese… Yuan Empire and Yuanan region take their names from Javan, father of Tarshish. In China, along the coast, there was a people called the Three Han by the early Chinese writers.
Han may be a derivation of Javan or Yahan.
They were recognized as being a very different people to the rest of the Chinese. The three were the Ma-Han, Shon-Han and the Pien-Han.
There is, as Bishop writes, a very close relationship between them and the people who settled Japan (Bishop 1925: 556). Their culture may be described as partly Chinese and partly central Asian (ibid, 558). Hurlimann traces them back to central Asia (Hurlimann 1970: 90) and Japanese traditions maintain they originated in the far west of Asia. (Odlum 1937: 17).
Colin in his Native Races and Their Customs writes:
“The principle settler in these archipeligoes was Tharsis, son of Java, together with his brothers.” (quoted in The Philippine Islands 1493-1898).
Of further interest is the statement in a Japanese document compiled in 720 AD, the Nihon Shoki; (The Chronicles of Japan), that Ninigi, a forefather of their race, had four sons. This may have been Javan, who also had four sons. From one of these sons descended the Japanese emperor Jemmu Tenno. This son was named Po-wori which means “Fire Bender” and may be compared to Tarshish which means “smelter” or “refiner”.
Japan’s role in Biblical Prophecy, Steve M Collins, 2007 – emphasis mine:
‘… Tarshish… A huge clue as to their modern identity is that Ezekiel 38:13 calls them “the merchants of Tarshish.” Their entire nation is so closely linked to merchandising goods to others that they are called a nation of “merchants”… Japan pioneered the export-driven model of mercantile sales to other nations as a national policy. This trait was so well-known that the nation was sometimes called “Japan, Inc.” in media articles… also prophesied [is] that there would be “young lions” that would be closely linked to the “merchants of Tarshish” in the latter days.
There are a number of smaller Asian nations on the Pacific Rim which have copied the mercantile, export-driven success of the Japanese nation. These nations are even called the “young tiger” nations or “young tiger” economies of Asia. The “young tiger” nations include such nations as South Korea, Taiwan, the Philippines, Singapore, Thailand…
Japan is an island nation and it lives at the doorstep of two powerful nations: Russia and China. Japan has fought wars with both nations, and China bears a vengeful grudge against Japan as a result of World War II. Russia seized Sakhalin and the Kuril Islands after World War II and its retention of these formerly Japanese islands is a bone of contention between Russia and Japan.
Japan cannot hope to make allies of these nations. Therefore, Japan must side with the USA and the West by default. However, Japan and the USA have grown to be genuine allies in the period after World War II. The USA was not a harsh conqueror of Japan.
The USA (in Japan’s post-World War period of reconstruction) preserved Japan’s monarchy, treated the Japanese people and their culture with respect and laid the foundation for Japan’s mercantile success by blending Western, democratic institutions with Japan’s own unique culture. Japan has become a trusted ally and friend and it becoming an ever-more important nation in the Western alliance.
An article… in… The Economist… stated that Japan: ‘seeks closer ties with democratic India’ – refer Chapter XIII India & Pakistan: Cush & Phut – ‘and recently formalized a security alliance of sorts, only Japan’s second, with Australia… in addition to becoming an ally of Australia, Japan “sought a new partnership with India while building security ties with South east Asia,” and that “the main catalyst for the security pact (is) the rise of China.”
Japan, Its Biblical Past and Future, Bob Thiel, 2007:
“Ise is the most venerated shrine in Japan, representing the indigenous religion, Shinto, and the mythical origins of the Japanese people. The sacred mirror is kept at Ise… individuals, who claim to have seen the mirror, agree that the horizontal writing on the bronze back is distinctly un-Japanese in style and resembles ancient Hebrew or Aramaic, spawning theories that connect the Japanese people to the ancient… [Israelite] tribes who vanished from history after the Assyrian conquest in 722 BC.
Scholars have found similarities in ancient Hebrew and Japanese ceremonies, priest apparel, the structure and layout of shrines, language used in ancient texts, and the three imperial regalia having been used as tokens of authority. It has also been argued that the Ise Shrine symbol, carved into the stone lamps surrounding the complex, is the Star of David.”
Thiel:
‘Perhaps it should be mentioned that in Japan there has long been a small Caucasian group who has been there for hundreds, if not thousands, of years. It is possible that they had some contact with the Middle East and brought that knowledge with them when they [ended] up in Japan.’
A significant identification of Tarshish in the past was its interaction with the descendants of Shem through extensive trade and its western cultural leanings; considerably more so than any other descendant of Japheth. In modern times, Japan has repeated this assimilation of all things western to become technologically almost more western than the West. It is ironic that this began after centuries of self-imposed isolation beginning in 1624, after the Japanese government refused a Spanish trading delegation to step on Japanese soil. Japan reluctantly came out of isolation due to American intervention and displays of naval sea power during 1853 to 1864.
March of the Titans, Arthur Kemp, 1999 & 2016, pages 374-376 – emphasis mine:
‘The Japanese government then began copying everything they saw in… European nations, a pattern for which their country later became famous.
French army officers were paid to enter Japan to remodel the Japanese army while British naval officers were paid to reorganise the Japanese Navy.
Dutch engineers were paid to supervise the construction of the first major Western style public works and infrastructure… and Japanese officials were sent abroad to study the… workings of [European] governments and to select their best features for duplication in Japan.
The new Japanese parliament [opened] in 1891, modelled directly on [European] parliaments… The Japanese constitution was drawn up by a specially-appointed commission under a samurai nobleman, Ito Hirobumi, who in 1882 sent missions to the US, Britain, France, Spain and Germany to observe their democratic systems. Eventually, the German model (and the Prussian variant in particular) was selected and implemented…
A new penal code was modelled on that of France, and a ministry of education, based on that of the United States, was established in 1871 to develop a system of universal education. Rapid industrialisation, under government direction, accompanied… political development and by 1890, Japan had completely revised its criminal, civil, and commercial law codes to match the European and American models.
By the end of the twentieth century, both Japan and China had developed into industrial giants, responsible for the production (but not the invention) of the majority of day-to-day appliances and convenience goods used all over the world. Both nations… practice immigration policies designed to preserve their racial homogeneity… unlike the … Western nations. Japan… famously refused to take Vietnamese boat people refugees of the 1970s and 1980s unless they were racially compatible with the existing Japanese population. This strict, racially-based immigration policy is [Japan’s]… formula for long-term survival and progress. If maintained, this policy will ensure that they escape the fate of Western nations who have abandoned such policies.’
Prisoners of Geography, Tim Marshall, 2016 & 2019, pages 239-240:
‘It is China that keeps Japanese leaders awake at night and keeps them close to the USA, diplomatically and militarily. Japanese statisticians fear that the population will shrink to under 100 million by the middle of the century. If the current birth rate continues, it is even possible that by 2110 the population will have fallen below the 50 million it was in 1910… [the Japanese population is rapidly ageing and predicted to drop to only ninety-five million people by 2050]
Japan, itself a re-militarising power with a quietly hawkish outlook, is going to require friends in the neighbourhood… this means the US 7th fleet will remain in the Bay of Tokyo and US Marines will remain in Okinawa, guarding the paths in and out of the Pacific and the China Sea… The waters can be expected to be rough.’
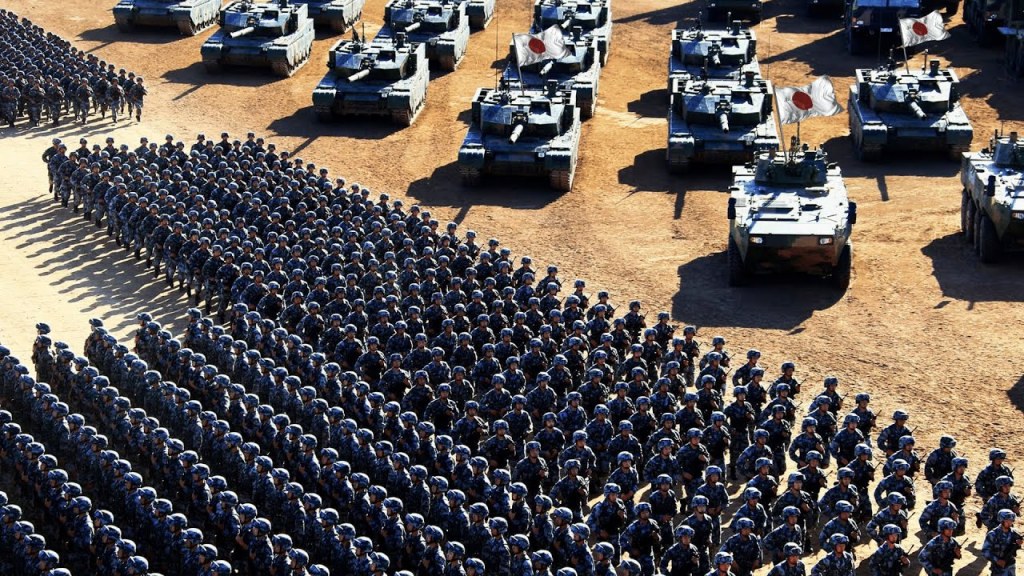
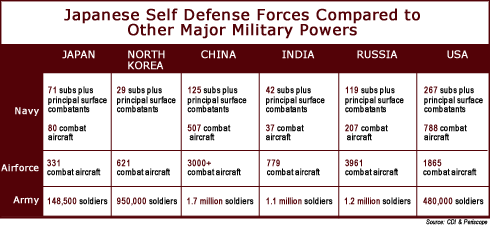
Japan is ranked 7th out of 145 countries in military strength for 2026 and is a top global military power. ‘The Japan Self-Defense Forces includes the Ground, Maritime, and Air Self-Defense Forces, and is undergoing significant modernization to enhance its capabilities in response to regional threats.’
In recent years, South Korea has overtaken Japan in overall military strength – refer Chapter VI Togarmah & the Koreas.
Yet it would be short-sighted and naive in considering Japan a less formidable foe. While Japan has not focused on developing a mighty military machine like China, or a rapid retaliatory strike force such as South Korea; Japan possesses instead, an extremely capable high-tech defence force.
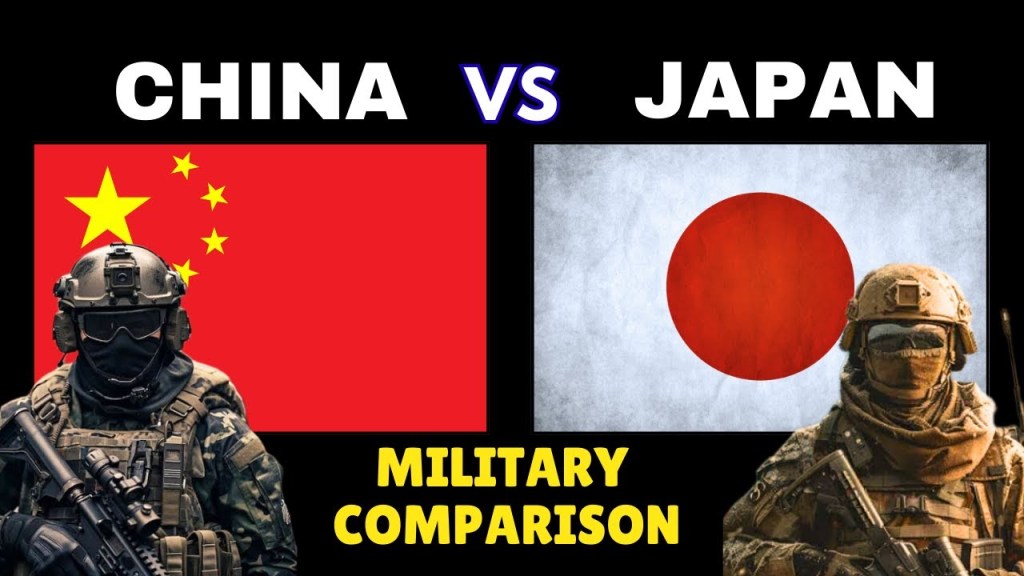
How Strong Is the Japan Military Compared to China Today? Logan Pierce, December 10, 2025 – emphasis mine:
‘When you look at Asia today, the spotlight keeps swinging back to a simmering standoff between two regional heavyweights: Japan and China.
Does Size Equal Strength in Modern Warfare?
China undoubtedly has a manpower advantage in active forces and reserves. But in modern warfare, numbers alone don’t decide outcomes. A smaller but well-equipped, well-trained, strategically deployed force (like Japan’s SDF) can be highly effective under the right circumstances.
Which Navy Holds the Advantage in East Asia?
If we’re just talking about size, China’s navy is the heavyweight in the room. Japan’s navy, on the other hand, is smaller overall but it’s extremely polished, well-trained, and laser-focused on operations close to home. Think fewer ships, but really capable ones.
In a Naval Standoff, Who Has the Edge?
China has the quantitative advantage, but Japan has localized strengths that could absolutely matter depending on the scenario. The winner isn’t guaranteed; it depends on where, how, and for how long the fight plays out.
Japan vs China Air Power: Who Controls the Sky?
China has spent years building a huge, diverse air arsenal. Japan’s approach is almost the opposite; fewer aircraft, but much higher quality per jet and a tighter, more integrated defense system. If you’re talking raw numbers and the ability to sustain a long air campaign, China has the upper hand. Their inventory is larger, their missile reach is longer, and they can simply throw more assets into the fight. But if the scenario is a quick, defensive clash near Japan’s own territory, Japan’s F-35s, radar coverage, and missile-defense layers give them a real shot at blunting an attack or at least holding their ground.
Ground Forces and Homeland Defense: Who’s Better Positioned?
In a broad regional sense, China has the advantage simply because of sheer numbers, logistics depth, and the ability to sustain a long fight. But if the discussion is strictly homeland defense, Japan arguably has the more strategically tuned setup. Their forces are positioned exactly where tensions are hottest, they train specifically for defending narrow island chains, and their alliance with the U.S. acts as a massive force multiplier.
Is Japan’s Military Stronger than China’s?
If we’re talking strictly on paper (e.g., troop numbers, ships, jets, budgets)… [and] about overall global strength, then no, Japan isn’t “stronger” than China… [but] the matchup isn’t “big vs. small,” it’s more like “broad power vs. specialized, sharpened power”… if the question is who holds up better in a fight near Japan’s own backyard, the answer could shift and maybe shift pretty dramatically. Japan doesn’t need to overpower China everywhere; it just needs to be a nightmare to attack. And it very likely is.’
Encyclopaedia:
‘Geisha, also known as geiko or geigi, are female Japanese performing artists and entertainers trained in traditional Japanese performing arts styles, such as dance, music and singing, as well as being proficient conversationalists and hosts. Their distinct appearance is characterised by long, trailing kimono, traditional hairstyles and oshiroi make-up. Geisha entertain at parties known as ozashiki, often for the entertainment of wealthy clientele, as well as performing on stage and at festivals.
Despite long-held connotations between sex and geisha, a geisha’s sex and love life is usually distinct from her professional life. Geishas are not submissive and subservient, but in fact they are some of the most financially and emotionally successful and strongest women in Japan…’
‘The kimono is a traditional Japanese garment and the national dress of Japan. The kimono is a wrapped-front garment with square sleeves and a rectangular body, and is worn left side wrapped over right, unless the wearer is deceased. ‘
Japanese society is linguistically, ethnically and culturally homogeneous, composed of 98.1%^^ ethnic Japanese. The most dominant native ethnic group is the Yamato. Primary minority groups include: the indigenous Ainu and Ryukyuan people and also Brazilians, mostly of Japanese descent. We will return to the Brazilian connection – Chapter XXIII Aram & Tyre: Spain, Portugal & Brazil.
Japanese men
A study by Hideaki Kanzawa, showed that the Jomon of Hokkaido and Honshu – the first of three peoples to have migrated into Japan – have a genome that is commonly found in Arctic populations but is rare in Yamato people.^^
According to Mitsuru Sakitani, the Jomon are an admixture of two distinct ethnic groups: a more ancient group, carriers of Y chromosome D1a2a (D-M55) and a more recent group, carriers of Y chromosome C1a1 (C-M8) ‘that migrated to Japan about 13,000 years ago.’
Haplogroup D1a2a is found in approximately 20% to 40% of the male population and Haplogroup C1a1 in about 6% of modern Japanese men.
Haplogroup D1a2a, originates in the Japanese archipelago and is distinct from other D-branches, with five unique mutations not found in the D1 Haplogroups. Scientists also propose that Haplogroup C1a1 originated about 12,000 years ago, which aligns with the start of the Jomon period.
According to a 2011 study, all major East Asian mtDNA lineages expanded prior to 8000 BCE, except for two Japanese lineages consisting of D4b2b1 and M7a1a expanding circa 5000 BCE, again during the Jomon Period.
Note, the mt-DNA Haplogroup D (above) not to be confused with Y-DNA Haplogroup D (below).
It is interesting how the timeline presented by scientists for the spreading and fanning out of the relevant ancient C and D Y-DNA Haplogroup mutations, mirror the dates of key events in our ancient past. The ending of the last ice age with the Flood in 10,837 BCE; according to an unconventional chronology – refer article: The Younger Dryas Stadial: Ending of the Earth… Beginning of the World* – and the birth of Tarshish sometime after this; as well as the ‘time of Peleg’ circa 6755 BCE.
We will investigate Peleg and the Tower of Babel, when we study Nimrod; Shem’s third son Arphaxad; and Abraham’s eldest brother, Nahor – refer Chapter XXI The Incredible Identity, Origin & Destiny of Nimrod; Chapter XXIV Arphaxad & Joktan: The Balts, Slavs & the Balkans; Chapter XXV Italy: Nahor & the Chaldeans; and article: The Pyramid Perplexity.
Some readers will be aware that the early Haplogroups are often given as originating much further back than 13,000 years ago. The pre-flood world’s chronology and the vast difference in human longevity – due in large part to environmental factors* – is a missing key in understanding the time frames of the antediluvian world. It will be a shock for some and others will be incredulous; as initially this writer was too, in the knowledge that before the Flood, human ages were of immense length.
A different method of counting was used – the sexagesimal system of the Sumerians, based on multiples of 60 as touched upon in Chapter I Noah Antecessor Nulla – and not the metric decimal system based on multiples of 10, we use today or the imperial system based on multiples of 12… a descendant of the Sumerian counting system.
The biblical ages of the pre-flood patriarchs appear to have been manipulated – making them easier to mentally digest – following the Flood, resulting in our real pre-history being extraordinarily hidden. The king lists for ancient rulers length of reigns – for instance in Sumer – are fantastically long (refer article: Na’amah), many thousands of years for individual rulers. Historians have just dismissed them as fanciful and created a completely erroneous timeline of history more in accord with those who squeeze all creation and mankind’s history into a mere six thousand years… based on a misguided interpretation of an edited biblical chronology – refer Chapter XXII Alpha & Omega.
The longevity of humans post-flood while considerable until the time of Abraham, were not nearly as long as prior to the flood – refer article: The Younger Dryas Stadial: Ending of the Earth… Beginning of the World.* A result of the Flood and the changes in the earth’s atmosphere, gravity and electro-magnetism was to reduce human life-span. An alternative explanation involving genetic manipulation cannot be entirely ruled out. From Abraham’s birth in 1977 BCE, we have witnessed human longevity reduce dramatically again to a ‘maximum’ of what we are now familiar with; consisting of approximately one hundred and twenty years.
Genesis 6:3
New Century Version
The Lord said, “My Spirit will not remain in human beings forever, because they are flesh. They will live only 120 years.”
This verse is actually predicting how much time was left before the Deluge flooded the Earth, though it has been commonly interpreted to refer to the length of a human’s life… and since the patriarch Joseph at least, this has been true – Genesis 50:22.
It is one of the reasons – perhaps the principal argument – in which the Serpent in the Garden of Eden, was able to convince Eve in taking the ‘fruit’ from the Tree of Knowledge of Good and Evil; deceiving her and Adam regarding the truth about life and death… subtly twisting what the Creator had taught. Adam and Eve didn’t die and in fact, lived for millennia – Article: DEATH: A Dead End or a New beginning?
Thus the promise of dying was delayed considerably, to the point of Adam and Eve appearing to almost live forever; though ultimately death came for them, with the tragic lie of the Serpent being eventually exposed – refer Chapter XXII Alpha & Omega.**
When scientists propose the earliest Haplogroups divided and sub-divided between 20,000 to 60,000 thousand years ago for example, this is inaccurate because Noah was born circa 17,000 BCE and possessed the entire genome for the races and Y-DNA Haplogroup A; which then mutationally diverged with his three son’s descendants and so on.
Noah’s sons were born circa 12,000 BCE – Genesis 5.32, 9.28, 11.10-11. Adam and his wife, (Mitochondrial) Eve, were formed nearly thirty-thousand years ago, circa 27,000 BCE and the line from which Noah descended was from their (second) son Seth, who was born circa 26,097 BCE. We will comprehensively study the antediluvian age in a separate chapter,** as well as an unconventional chronology for the history of humankind – Appendix IV: An Unconventional Chronology.
Japanese women
It is believed the Yayoi people – the second group of people to migrate into Japan (after the Jomon) – were migrants to the Japanese archipelago from Korea (or China) during the Yayoi period from 1000 to 300 BCE. They are seen as the direct ancestors of the modern Yamato – the majority of Japanese – as well as the Ryukyuan.
It is estimated that modern Japanese share on average about 90% of their genome with the Yayoi. There was a third period of major migration, during the Kofun period from 250 to 538 CE.
Ancient DNA rewrites early Japanese history – modern day populations have tripartite genetic origin, Trinity College Dublin, 2021:
‘Ancient DNA extracted from human bones has rewritten early Japanese history by underlining that modern day populations in Japan have a tripartite genetic origin – a finding that refines previously accepted views of a dual genomic ancestry. Twelve newly sequenced ancient Japanese genomes show that modern day populations do indeed show the genetic signatures of early indigenous Jomon hunter-gatherer-fishers and immigrant Yayoi farmers – but also add a third genetic component that is linked to the Kofun peoples, whose culture spread in Japan between the 3rd and 7th centuries.’
A 2007 study by Nonaka, reported that the frequencies of the D1, (O1b), and O2** lineages in Japan were 38.8%, 33.5%,* and 16.7% respectively, constituting approximately 90% of the Japanese (male) population.
It is thought that the Yayoi mainly belonged to Haplogroup O1b2 (O-M176) found in 32%* of present day Japanese males; Haplogroup O-M122 (O2, formerly O3); Haplogroup O-K18 (F2320 – O1b1); and Haplogroup O-M119 (O1a) which are all typical for East Asian and Southeast Asians.
Mitsueu Sakitani, suggests that Haplogroup O1b2, which is common in today’s Japanese, Koreans, and some Manchu, and O1a are one of the carriers of Yangtze civilisation. As the Yangtze civilisation declined, several tribes crossed westward and northerly, to the Shandong peninsula, the Korean peninsula and the Japanese archipelago. One study labels Haplogroup O1b1, a major Austroasiatic paternal lineage and the Haplogroup O1b2 of Koreans and the Japanese as a ‘para-Austroasiatic’ paternal lineage.
A study in 2018, confirmed that the modern Japanese are predominantly descendants of the Yayoi and that they largely displaced the local Jomon. The mitochondrial chromosomes of modern Japanese are nearly identical with the Yayoi and differ significantly from the Jomon population. It is estimated that the majority of Japanese have about 12% Jomon ancestry or less.^ A more recent study by Gakihari in 2019, estimates the gene-flow from the Jomon into modern Japanese people at only 3.3%.^
Further studies report:
‘A 2011 SNP consortium study done by the Chinese Academy of Science and Max Planck Society consisting of 1,719 DNA samples determined that Koreans and Japanese clustered near to each other, confirming the findings of an earlier study that Koreans and Japanese are related [as cousins – Chapter VI Togarmah & the Koreas].
However, the Japanese were found to be genetically closer to [their] Southeast Asian [sibling] populations as evident by a genetic position that is significantly closer towards Southeast Asian populations on the principal component analysis (PCA) chart [refer Chapter VII Javan: Archipelago South East Asia & Polynesia].
Some Japanese individuals are also genetically closer to Southeast Asian and Melanesian populations when compared to other East Asians such as Koreans and Han Chinese, indicating possible genetic interactions between Japanese and these populations.
A 2008 study about genome-wide SNPs of East Asians by Chao Tian et al. reported that… the Japanese are relatively genetically distant from Han Chinese, compared to Koreans. Another study (2017) shows a relative strong relation between all East and Southeast Asians.’
We would expect to see the evidence of a link between Tarshish and his brothers located in archipelago Southeast Asia. Nor is it a surprise that the Japanese have DNA in common with Koreans and Chinese, for two reasons.
First, they are originally blood brothers, then becoming cousins all stemming from Japheth and second, there would have been noticeable admixture if the Japanese migrated through China, possibly Taiwan and then the Korean peninsula. Similar transference occurred when Koreans migrated through China and some travelled to the Japanese Islands; as well as Chinese traders who visited both Korea and Japan.
The key in answering the Japanese identity, is not with the Japanese clustering with Koreans descended from Togarmah (Gomer), but rather their closer genetic link with South East Asians (Kittim, Elishah and Dodan) also descended from Javan.
Dual origins of the Japanese: common ground for hunter-gatherer and farmer Y chromosomes, multiple authors, 2006 – emphasis mine:
‘This survey of Y chromosome SNPs in Asia reveals a set of 41 haplogroups, 19 of which are present in Japan. Three haplogroups are almost entirely restricted to the Japanese archipelago: haplogroup D-P37.1 and its descendants (D-P37.1*, D-M116.1*, D.M125*, and D-P42), O-47z, and C-M8.
These lineages account for 34.7, 22.0, and 5.4% of Japanese Y chromosomes, respectively, and may have originated on the Japanese archipelago. The Japanese population also has high frequencies of other haplogroup O lineages that are shared mainly with Southeast Asian populations, and C lineages that are shared primarily with northern Asians. In this section, we make the case that these Y chromosome lineages descend from different ancestral populations that gave rise to the Jomon and Yayoi cultures.
We plotted the frequencies of haplogroups D, O-P31 [O1b], and O-M122 [O2] in each of our six Japanese samples against the approximate geographic distances of each of these populations from Kyushu Island. Together, these haplogroups account for 86.9% of Japanese Y chromosomes. There is a U-shaped cline for haplogroup D, and inverted U-shaped patterns for haplogroups in clade O. Based on the frequencies of these two clades, we estimate the Jomon contribution to modern Japanese to be 40.3%,^ with the highest frequency in the Ainu (75%) and Ryukyuans (60%).
On the other hand, Yayoi Y chromosomes account for 51.9% of Japanese paternal lineages, with the highest contribution in Kyushu (62.3%) and lower contributions in Okinawa (37.8%) and northern Honshu (46.2%). Interestingly, there is no evidence for Yayoi lineages in the Ainu [only Jomon].
The highest frequency of continental D lineages is found in central Asia (especially in Tibet (50.4%). Evidence for shared ancestry between Tibetans and Japanese is seen in the MDS plot. The survival of ancient lineages within haplogroup D in Tibetans and Japanese may well reflect long periods of isolation for both groups. Interestingly, a Y-SNP survey of Andaman Islanders found a very high frequency of haplogroup D-M174* [D1] chromosomes in this isolated population…’
The connection between higher levels of Y-DNA Haplogroup D and isolated, endogamic Asian populations is important. The Tibetans have been secluded from external contact and mixture for centuries as have the Japanese. The fact that Tibet and Japan – two very isolated regions – possess an ancient and prime Haplogroup, with a high percentage cannot be a coincidence.
‘The other postulated Japanese Paleolithic founding haplogroup, C-M8 [C1a1], is associated with Y-STR haplotypes that are related to Indian and central Asian C chromosomes. The presence of NO* chromosomes in Japan also may be an indication of a remnant Tibetan ancestry. A recent mtDNA study revealed direct connections of Japanese haplotypes with Tibet, parallel to those found for the Y chromosome.
Haplogroup M12 is the mitochondrial counterpart of Y chromosome D lineage.
This rare haplogroup was detected only in mainland Japanese, Koreans, and Tibetans, with the highest frequency and diversity in Tibet.
Our data also support the hypothesis that other Y haplogroups, such as lineages within haplogroup O-M122 (i.e., O-M134 and O-LINE), as well as the O-M95 lineage within O-P31, entered Japan with the Yayoi expansion.
High frequencies of these lineages in southwestern Japan, Korea, and Southeast Asian populations likely explain the affinity of these populations in the MDS plot.
The entire O haplogroup has been proposed to have a Southeast Asian origin (Su et al. 1999; Kayser et al. 2000; Capelli et al. 2001; Karafet et al. 2001). In fact, nearly all lineages within the O-M175 clade… except O-SRY465 and O-47z, are present at their highest frequencies (e.g., O-M95, O-P31*, M122*, O-LINE, O-M119) in southeastern Asia/Oceania, and have been proposed to have southern Chinese origins…’
This is a significant parallel connection between the related peoples of Korea and continental South East Asia and Japan and archipelago South East Asia. Togarmah-Korea is closely connected to Ashkenaz-Vietnam (and Riphath-Cambodia); as Tarshish-Japan is related to Elishah-Malaysia, Dodan-Philippines and Kittim-Indonesia.
While the ancient Y-DNA Haplogroup D is almost entirely indicative of descendants from Japheth (D1), it is found in a small number of males descending from Canaan (D2). This might be explained by the connecting Y-DNA Haplogroup DE acting as a bridge between the two – as these two disparate peoples share male ancestors in common due to the YAP+ mutation – for the defining Y-DNA Haplogroup for males descended from Canaan is Haplogroup E (Chapter XII Canaan & Africa).
Phylogentic Tree by ISOGG (Version 14.151)
DE (YAP) Nigeria, Guinea-Bissau, Caribbean, Tibet
D (CTS3946)
D1 (M174) East Asia, Andaman Islands, Central Asia, Mainland Southeast Asia
– D1a1b (P99) Mainland China, Tibet, Mongol, Central Asia
D1a2 (Z3660)
– D1a2a (M55) Japan (Yamato)
– D1a2b (Y34637) Andaman Islands (Onge and Jarawa)
D1b (L1378) Philippines (Ryukyuan and Ainu of Japan)
D2 (A5580.2) Nigeria, Saudi Arabia, Syria, African Americans
Notice how D1a1 is indicative of mainland Asia; while D1a2 is found in Japan. Similarly, D1b is found in the Philippines as well as the indigenous Ryukyuan and Ainu of Japan. This lends support to Filipino men once living on Taiwan and dispersing from the island to the Philippine archipelago.
Wa-pedia – emphasis mine:
‘The origins of the Japanese people is not entirely clear yet. It is common for Japanese people to think that Japan is not part of Asia since it is an island, cut off from the continent [akin to the British who are alienated from Europe; whether in customs, culture, politics or national identity]. This tells a lot about how they see themselves in relation to their neighbours. But in spite of what the Japanese may think of themselves, they do not have extraterrestrial origins, and are indeed related to several peoples in Asia.’
Many a word spoken in jest – refer articles: Homo neanderthalensis I, II, III & IV.
‘Kenichi Shinoda (2003) found Chinese-looking maternal lineages (haplogroups A, B, F, M8a and M10) in the Kanto region dating from the late Jōmon period mixed with typical Jōmon lineages (M7a, N9b)… this could indicate that farmers from mainland China colonised Japan several millennia before the Yayoi invasion, which would explain why the Japanese also possess typically South Chinese Y-haplogroups not found in Korea, such as O1a, O2a [now O1b], O3a1c [now O2a1c1 – F18] and O3a2 [now O2a2 – P201].
Haplogroup C is another extremely old lineage that… spread over most of Eurasia. Two subclades of C are found in Japan: C1a1 (aka C-M8, formerly C1) and C2a (aka C-M93, formerly C3).
Both are likely to have been in the Japanese archipelago since the first human beings reached the region… Haplogroup C1a seems to have split… in the middle of Eurasia, one group going west to Europe, and the other east to Japan. C1a2 is now nearly extinct in Europe. C1a1 is particularly common in Okinawa (7%), Shikoku (10%) and Tohoku (10%), but is apparently absent from Hokkaido and Kyushu.’
An explanation for this occurrence, would be that Tarshish (Jomon, Haplogroup C, D and Yayoi, Haplogroup O) migrated through Central Asia as the other sons of Japheth – though like some of their sea-faring, maritime bothers descended from Javan, for example the Malays from Elishah (and the Maori from Rodan) – a portion (Jomon, Haplogroup D) likely travelled from the Mediterranean heading east through West Asia, prior to migrating southwards and around southern Asia. Continuing to circumnavigate Southeast Asia and travelling northward beyond China to Japan – Chapter VII Javan: Archipelago South East Asia & Polynesia.
Paternal Haplogroup C1 is more commonly associated with Central Asia and northern Asia, while Haplogroup C2 in East Asia and Amerindian men of the Americas.
Wa-pedia:
‘Haplogroup C2a, representing also 3% of the population, is typically found among the Mongols, Manchus, Koreans and Siberians, which suggest a propagation by the Yayoi farmers. The last surviving tribes of ‘pure’ Ainu people, living on the island of Sakhalin in Russia, just north of Hokkaido, possess 15% of C2a (the remaining 85% being D1b [D1a2a]). There is therefore a good chance that C2a could also have come to Japan from Siberia through Sakhalin and Hokkaido. C2a is indeed found at both extremities of the country, peaking in Kyushu (8%), Hokkaido (5%), but is rare in central Japan, which supports the theory of two separate points of entry.
Over 40% of Japanese men belong to haplogroup D, a paternal lineage…
Its first carriers would have migrated along the coasts of the Indian Ocean, from the Arabian peninsula all the way to Indonesia, then following the chain of islands up through the Philippines and using the land bridge from Taiwan through the present-day Ryukyu islands to Japan.’
When studying the Bible verses regarding Tarshish, we contemplated that the outposts of Tarshish from the mediterranean via India and Southeast Asia could lead to Japan. Therefore, not only were the various locations given for the ports of Tarshish accurate, they also provide a trail of approximately half of Tarshish’s male descendants all the way to Japan over a period of about 5,500 years – until the arrival of the Yayoi in 1000 BCE.
Wa-pedia:
‘Haplogroup D1b [D1a2a] (aka D-M55 or D-M64.1, formerly known as D2)… is found almost exclusively in Japan, with a small minority in places who have had historical ties with Japan, such as Korea.
D1b is most common in Hokkaido (60-65%)… If D1b colonised Japan from the north, it would explain why its frequency is highest in northern Japan and, conversely also why [allegedly] pre-LGM [Last Glacial Maximum] lineages like C1a1 survived better in southern Japan…
The only other variety of D identified among the Japanese is D1a1[a] (D-M15), which only makes up 0.5% of the Japanese male population. This haplogroup is particularly common among some ethnic groups from Southwest China and Indochina, such as the Hmong and Ksingmul in Laos… and the Yao people in Guanxi and Vietnam. Tibetans carry about 54% of haplogroup D.
Andaman Islanders belong to the basal D*. It means that their most recent common ancestors goes back tensof thousands of years. In other words the genetic gap between these ethnic groups is immense, despite false appearances of belonging to a common haplogroup.
Haplogroup D1b [D1a2a]… [is thought to have] formed 45,000 [13,000] years ago, [after the flood cataclysm bottleneck], but the most recent common ancestor of Japanese D1b members lived 23,000 [circa 10,000] years ago [or less after the births of Japheth and Canaan’s sons] which means that other D1b branches may have become extinct outside Japan. Haplogroup D1b is found among the Ryukyuans as well as the Ainus, and is thought to have been the dominant paternal lineage of the Jōmon people.
Almost exactly half of Japanese men belong to haplogroup O, a paternal lineage of Paleolithic Sino-Korean origin that is now found all over East and Southeast Asia. Haplogroup [O1b2 – M176*] (aka O-SRY465) is found especially in Manchuria, Korea and Japan, and very probably came to Japan with the Yayoi people. It reaches its highest frequency in western Japan (35%) and is least common in Hokkaido (12.5%) and Okinawa (22%). In the rest of the country its frequency is around 30%.
Approximately two thirds of the Japanese [O1b – M268] belong to the [O1b2] subclade, which is much less common in Korea and Manchuria… Haplogroup [O1b2] (SRY465, M176): Found almost exclusively among the Korean, Japanese, Thai, Vietnamese and Indonesian. Haplogroup O-47z [O1b2a1a1 – F1204; a sub-clade of OK10 from O-M176*]: Found frequently among Japanese and Ryukyuans, with a moderate distribution among Indonesians, Koreans, Manchus, Thais, and Vietnamese.
Haplogroup [O2] (aka O-M122) is the main Han Chinese paternal lineage. It is an extremely diverse lineage, with numerous subclades, including many associated with the expansion of agriculture from northern China. Most of them are found in Korea and would have been part of the Yayoi migration to Japan.
Within Japan, it reaches a maximum frequency in Okinawa (16%),** a region with low Yayoi ancestry. Its frequency among non-Okinawan Japanese is of 10-15%, about twice higher than in Korea, a fact that cannot be explained by the Yayoi invasion.
A negligible percentage of the Japanese belong to haplogroup O1a (aka O-M119), a lineage especially common in southern China, Taiwan, the Philippines, Malaysia and Indonesia, and haplogroup O2a1 (aka O-M95 [L127]), which is found in south-west China, Indochina, around Malaysia and in central-eastern India. Both of them might have also have come with South Chinese Neolithic farmers during the Jomon period.
Approximately 3% of Japanese men belong to haplogroup N, a lineage that is thought to have originated in China… but underwent a serious population bottleneck during the Last Glacial Maximum, and re-expanded after that.
Japanese people belong to N1… Haplogroup N1 was found at high frequency (26 out of 70 samples, or 37%) in Neolithic and Bronze Age remains (4500-700 BCE) from the West Liao River valley in Northeast China (Manchuria) by Yinqui Cui et al. (2013). Among the Neolithic samples, haplogroup N1 represented two thirds of the samples from the Hongshan culture (4700-2900 BCE) and all the samples from the Xiaoheyan culture (3000-2200 BCE).
Haplogroup N1c is found especially among Uralic and Turkic peoples… including among the Finns, Estonians and Sami in Northeast Europe, and among the Turks in Central Asia and Turkey. It is found at low frequencies in Korea and could have arrived with the Yayoi people.
A comparison of Malay (Bahasa Indonesia/Melayu) and Japanese languages reveals a few uncanny similarities. Apart from the very similar phonetics in both languages, the same hierarchical differences exist in personal pronouns. For example ‘you’ can be either anda or kamu in Malay, and anata and kimi in Japanese.
Not only are the meaning and usage of each identical, but they also sound almost the same. Likewise, the Japanese verb suki (to like) translates suka in Malay. The chances that this is a pure coincidence is extremely low, and may reveal a common origin. Furthermore, in both languages the plural can be formed by simply doubling the word. For instance, in Japanese hito means ‘person’, while hitobito means ‘people’. Likewise ware means ‘I’ or ‘you’, whereas wareware means ‘we’.
Doubling of words in Japanese is so common that there is a special character used only to mean the word is doubled (々) in written Japanese. In Malay, this way of forming the plural is almost systematic (person is orang, while people is orang-orang). Furthermore, expressions like ittekimasu, itteirashai, tadaima and okaeri, used to greet someone who leaves or enter a place, and which have no equivalent in Indo-European languages, have exact equivalents in Malay/Indonesian (selamat jalan, selamat tinggal…).
One could wonder how Malay and Japanese ever came to share such basic vocabulary and grammatical features, considering that there is no known historical migration from one region to other.’
The preceding paragraph is truly incredible, if one did not suspect a common ancestor (Javan) linking Tarshish-Japan with Elishah-Malaysia. Yet the constant reader will know already the obvious linguistic and ethnic tie between two such geographically seeming separate peoples, is easily, logically and reasonably explained; for they share the same father, Javan – Chapter VII Javan: Archipelago South EastAsia & Polynesia.
As we have learned with Togarmah-Korea and Ashkenaz-Vietnam, both sons of Gomer, a genetic link proves beyond a shadow of a doubt the familial bond of sibling brothers.
Wa-pedia:
‘The Palaeolithic Jōmon people are thought to have arrived from Austronesia during the Ice Age. The original inhabitants of Indonesia and the Philippines might have been related to Dravidians of Southern India – refer Chapter VII Javan: Archipelago South East Asia & Polynesia.
Y-haplogroup C, which has been associated with the first migration of modern humans… towards Asia, is relatively frequent in Kerala (southern tip of India) and Borneo. These early Austronesians are thought to have been the ancestors of the Ice Age settlers of Japan (Y-haplogroups C1a1 and D1b [D1a2a]). The common root of the two languages must be more recent, and indeed there is one migration that could explain the connection between the two groups: the Neolithic Austronesian expansion from southern China.’
Recall in Chapter VII Javan: Archipelago South East Asia & Polynesia; where the Polynesians descended from Rodan and the Melanesian and Negritos peoples were investigated. The suspicion was that the physiognomy of these people, particularly the Australian Aborigine was similar to the Dravidian Indian. We will return to this question as the evidence indicates the Melanesians are not descended from Japheth, but rather from Ham – refer Chapter XIII India & Pakistan: Cush & Phut.
Wa-pedia:
‘From approximately 5,000 BCE, South Chinese farmers expanded southward to Taiwan and Southeast Asia, bringing Y-haplogroups [O1a, O1b and O2] to the region, which are still the dominant paternal lineages today. There is evidence of farming in Taiwan at least from 4000 BCE, but agriculturalists would probably have arrived earlier considering that the Neolithic reached the Philippines circa 5000 BCE, and Vietnam, Thailand, Malaysia and Indonesia around 4,000 BCE… the same migration could have followed the Ryukyu archipelago until Kyushu, then colonised Honshu and Shikoku. In fact, there is no good reason why these seafaring farmers would travel as far as Indonesia and not to Japan, which is much closer.
Many more Japanese words could be of Austronesian origin. The linguist David B. Solnit estimates that among 111 common Japanese words he analysed, 28% had Austronesian cognates only, while 40% had Altaic cognates, 23% competing cognates, and 9% no cognate in either.
Considering that the various branches of Proto-Austronesian split over 6,000 or 7,000 years ago, longer than Indo-European languages, it is not surprising that even languages that are undeniably classified as Austronesian… have evolved very diverging vocabularies today (except Polynesian languages, which only started to diversify with the Polynesian expansion 2,000 years ago).
It is generally more useful to look at the Proto-Autronesian root of words rather than to try to find direct matches between modern Japanese and modern Austronesian languages. For example, the Proto-Austronesian root for fish is *sikan, which gave sakana in Japanese (and maybe also ika, which means squid), ikan in Malay, ika in Fijian, and isda in Tagalog. Cases of high lexical-semantic retention over six millennia like kamu/kimi, anda/anata and suka/suki are extremely rare. The Austronesian connection with Japanese was first suggested in 1924 by the Dutch linguist Dirk van Hinloopen Labberton.
Many linguists have since proposed the hypothesis that the Japonic language family evolved from an Austronesian substratum (Jōmon) onto which was added an Altaic superstratum (Yayoi).
However, if Austronesian speakers came to Japan with South Chinese Neolithic agriculturalists, the original Jomon people would have spoken another language, either one of Siberian origin, in light of the mtDNA ties between Jomon and Ainu people and eastern Siberians, or a language isolate, reflecting the uniqueness of the Jomon paternal lineage. Therefore, Middle and Late Jomon people would already have spoken a hybrid language. Likewise, the Koguryoic Korean language of the Yayoi people would also be a hybrid incorporating Altaic elements of Mongolian origin into an older Korean substratum of Paleosiberian origin.
Since the 6th century CE, the Japanese started incorporating words from Chinese after adopting Buddhism and Chinese characters, in the same way that English absorbed a huge amount of Norman French and Latin words in the late Middle Ages [a further Japanese and British similarity]… approximately half of the Japanese vocabulary is of Chinese origin.
This explains why Japanese does not neatly fit in one or even two linguistic families, but is a hybrid of at least five separate sources: aboriginal Jomon, Austronesian, Korean, Altaic and Chinese.
Cultural and religious similarities also exist between Japan and Austronesia… most ethnic Malays and Indonesians are Muslim, but traditional religion survives in some islands, including Bali, which practices a syncretic form of Hinduism and aninism. Basically, Balinese religion is a form of Hinduism that has incorporated the aboriginal animistic religion. The parallel with Japan is obvious for people familiar with this culture.
Japanese Shintoism is also a form of animism, and is practised side-by-side with Buddhism, a religion derived from Hinduism, sometimes blending the two religions in a syncretism known as Shinbutso-shugo. The relation between Hinduism and Buddhism is irrelevant here, and both are relatively recent imports in historical times. Before that, however, Jomon people and Neolithic Austronesians would have practised a very similar form of animism.
Japanese matsuri (festivals) resemble so much Balinese ones that one could wonder if one was not copied from the other.
During cremations in Bali, the dead body is carried on a portable shrine, very much in the way that the Japanese carry their mikoshi. Balinese funerals are joyful and people swinging the portable shrine in the streets and making loud noise to scare the evil spirits.
There are lots of other cultural similarities between ancient cultures of Indonesia and Japan.
For example, both Balinese temples and Japanese shrines, as well as traditional Japanese and Balinese houses have a wall surrounding them, originally meant to prevent evil spirits from penetrating the property. Despite the radical changes that Indonesian culture underwent after the introduction of Islam and Christianity, and the changes that Buddhism brought to Japan, it is still possible to observe clear similarities between the supposed original prehistoric cultures of the two archipelagoes.’
This is at once incredible yet is not, for we would expect more similarities between Japan and its related kin in Malaysia, Indonesia and by extension the Philippines and Polynesia; whether culturally, linguistically or ethnically, rather than with China or even Korea. The Koreans and Chinese are cousins, whereas the language and cultural similarities with the Malay peoples supports the proposition that the Japanese as Tarshish, are the brother of Elishah of Malaysia, Kittim of Indonesia, Dodan of the Philippines and Rodan of Polynesia.
Recall, an earlier quote from Chapter VI Togarmah & the Koreas.
‘Wa-pedia: “The study…[of]… Jung et al. (2010) said… that Koreans are genetically homogenous. The study said that the affinity of Koreans is predominately Southeast Asian with an estimated admixture of 79% Southeast Asian and 21% Northeast Asian for Koreans… all of the Koreans which were analyzed uniformly displayed a dual pattern of Northeast Asian and Southeast Asian origins.
The study said that Koreans and Japanese displayed no observable difference between each other in their proportion of Southeast Asian and Northeast Asian admixture.”
Japanese man and woman
The principle Japanese mtDNA Haplogroups include:
D4 [34%] – M7 [12.5%] – B4 [7.5%] – G [7.5%] – A [7%]
– N9 [7%] – F [5.5%] – B5 [4.5%]
A comparison of mtDNA Haplogroups common throughout Southeast Asia such as M7, B5 and F1 show that the percentages decrease in both estranged northern nations. Japan and Korea have similar levels and more closely match the Philippines, which happens to be located between the northern two and the southern nations of Malaysia, Vietnam and Thailand who all have higher percentages overall.
Even though mtDNA Haplogroup D is the primary maternal Haplogroup in the Koreas as well as in Japan and Haplogroups M and F figure prominently, it is as noted in previous chapters, Haplogroup B which as the common thread binds the descendants of Japheth from Tiras, Madai, Gomer and Javan.
The principal Y-DNA Haplogroups for the minority peoples in Japan: the Ainus descended from the Jomon; and the Ryukyuans, descended from the Yayoi.
Region / Haplogroup
C
D1b
N
O1a
O1b
O2
Q
Others
Ainus (n=20)
15%
85%
0%
0%
0%
0%
0%
0%
Ryukyuans (n=132)
8.5%
45.5%
1.5%
1.5%
23%
19%
0%
1%
Notice the males of the Ainus and Ryukyuans both carry D1b which is found in the Philippines.
The Y-DNA Haplogroups for the Yamato majority of Japan.
A simplified percentage sequence for the Y-DNA Haplogroups.
Japan: D1a [39.5%] – O1 [31.5%] – O2 [19%] – C [7%] – N [2%] – Q [0.1%]
The Japanese possess the key Oriental and East Asian Haplogroups O and C (with the absence of K); while exhibiting the lesser marker Haplogroups, N and Q. The very high percentage of Y-DNA Haplogroup D is unique amongst the descendants of Japheth with the only other peoples bearing similar high levels, the Tibetans of Tibet.
Japan: D1 – O1b – O2 – C – N – O1a – Q
Malaysia: O1b – O2a1 – O1a – K – C – F
Indonesia: O2 – O1b – O1a – C – K – D1
Korea: O2 – O1b – C – N – O1a – D1 – Q – K
Vietnam: O2 – O1b – Q – O1a – C – D1 – N
Philippines: O2 – O1a – K – C – O1b
A comparison of Japan with a selection of the nations studied thus far reveals the similarity of the East Asian peoples descended from Japheth’s sons, Javan and Gomer; while at the same time highlighting the unique and different paternal heritages. The Japanese are clearly distinct with high levels of D1. The second major Japanese Haplogroup is O1b and so it is Malaysia – which has O1b as their principle group – that is ostensibly closer to the Japanese – as shown on the PCA graph below. We have discussed the close linguistic ties between the two peoples.
The other four nations, two from Javan – Indonesia and the Philippines – and two from Gomer, all share O2a1 as their prime Haplogroup and so are further removed from the peoples residing on the Japanese isles.
Japan: D1a [39.5%] – O1b [30%] – O2 [19%] – C [7%] – N [2%]
– O1a [1.5%] – Q [0.1%]
Malaysia: O1b [32%] – O2 [30%] – O1a [8%] – K [8%] – C [6%]
– F [6%]
Korea: O2 – [42.1%] – O1b [ 33.1%] – C [12.9%] – N [3.8%]
Philippines: O2 – [39%] – O1a [28%] – K [20%] – C [5%]
– O1b [3%]
Comparing the defining marker Haplogroups of O, C and K, with the addition of Japan. The four main descendants of Javan have a distinct Y-DNA Haplogroup sequence; yet in these core groups, Japan and Malaysia bridge a closer gap overall with the Philippines and Indonesia bridging the other, albeit not as closely.
Taiwan: O1a [66%] O1b [11%] O2a1 [11%] C [0.4%]
Korea: O1a [3%] O1b [33%] O2a1 [42%] C [13%] K [0.5%]
Vietnam: O1a [6%] O1b [33%] O2a1 [40%] C [4%]
Philippines: O1a [28%] O1b [3%] O2a1 [39%] C [5%] K [20%]
Indonesia: O1a [18%] O1b [23%] O2a1 [29%] C [13%] K [3%]
Malaysia: O1a [8%] O1b [32%] O2a1 [30%] C [6%] K [8%]
Japan: O1a [1.5%] O1b [30%] O2a1 [19%] C [7%]
Togarmah is estranged from his brothers in continental southeast Asia and of those brothers, Ararat, Minni, Riphath and Diphath, it is Ashkenaz with whom the clear closer genetic tie is shared – Chapter V Gomer: Continental South East Asia.
Similarly, Tarshish is estranged from his brothers in archipelago Southeast Asia; yet in stark contrast with Togarmah, none of his brothers, whether Kittim, Dodan or Rodan is similar. It is Elishah that the semblance of a closer genetic tie is exhibited.
Continuing the comparison table begun in chapter four for those peoples of Japhetic lineal descent; including samples from Tiras, Madai, Gomer, Javan’s sons, now with the addition of Tarshish.
O O2a1 O1a O1b C D K Q N
NA Amerindian 6 77
Cook Islands 5 83 8
Kazakhstan 8 40 10 2 7
Micronesia 9 19 65
Japan: 51 19 1.5 30 7 40 0.1 2
Sulawesi 51 17 21 13 22 7
Tonga 60 23 1
Borneo 66 36 9 21 22
Indonesia 69 29 18 23 13 0.5 3
Malaysia 70 30 8 32 6 8
Philippines 70 39 28 3 5 20
Sumatra 72 40 18 14 5 2 4
Vietnam 79 40 6 33 4 3 7 3
South Korea 79 42 3 33 13 2.5 0.5 2 4
Bali 84 7 18 59 2 1 0.4
Java 88 23 23 42 2 2
Taiwan: 88 11 66 11 0.4
The five regions of Indonesia are retained due to the diversity of its large population. Immediately, a number of points concerning the Japanese are apparent.
First, the Japanese are one of the few peoples to have minute trace levels of the interconnecting Haplogroup, K.
Second, the minute percentage of Haplogroup O1a compared with their eastern relatives. In so doing, a percentage for total Haplogroup O which would otherwise be comparable with Malaysia at 70% does not exist.
Third, though the Japanese possess an average level of O1b, similar to South Korea and Malaysia, they have a much lower level of O2, in keeping with much of Indonesia. Especially similar to the Indonesian island Sulawesi, with O2 and total Haplogroup O percentages matching.
Fourth, this is due to a higher percentage in a Haplogroup other than O, like Sulawesi. For Sulawesi it is Haplogroup C and for Japan, it is Haplogroup D.
Fifth, the dominance of D in the men of Japan as the defining paternal marker Haplogroup puts them along side those other peoples which are defined by a Haplogroup other than O: and not with the Taiwan aborigines with 66% in O1a; Bali with 59% in O1b; or South Korea with 42% in O2.
Those peoples include, the Cook Islander men with 83% of Haplogroup C; Micronesia with 65% of K; and the North American Indian males with 77% of Q.
In fact, no one else – excepting Tibet – has any percentage above 3% for D1. Japan is glaringly unique in the Japheth lineage. A study of the Japanese themselves only bears out their singularity in all aspects amongst East Asian peoples.
The next chapter concludes the study on Japheth’s children and what a finale it is.
Someone might say, “Look, this is new,” but really it has always been here. It was here before we were.
Ecclesiastes 1:10 New Century Version
“The more obvious a discovery, the more obvious it seems afterwards.”