Chapter XII
Conventionally, Canaan is the fourth and youngest son of Ham. Yet, as discussed in the previous chapter, enough evidence exists to cast doubt on the scriptural account as presently translated in the Book of Genesis – Chapter XI Ham Aequator.
Editing in later manuscripts appear to have sought to cover Canaan’s true identity as actually the fourth and youngest son of Noah. The complex and distinct genetic blueprint for Canaan’s descendants, convincingly supports this premise.
Initially for the purpose of the current study and the coherence of The Noachian Legacy it was endeavoured to retain as a whole, the orthodox view of Canaan’s parentage. After more thorough investigation, this writer is fully persuaded that this position is untenable. Therefore, an apologetic approach has been fully dismissed and replaced with a teaching clearly supported by science and scripture.
Before we continue in earnest, there is a vital key to understanding not just Canaan but numerous identities to follow. This matter is being laboured as it has been the single biggest block in understanding where the peoples of the Bible were in the past and where they are now. It requires a return to point number two in the introduction (primus verba).
Original peoples dwelt in a region after the Flood; then they migrated. New peoples would move in; they then would be known by the names already associated with the area, the actual land, invariably from the previous dwellers. Tracking and identifying these former peoples, plus now the new ones becomes difficult, because historians and researchers assume they can rely on the names already established for the land area as still being applicable to the new migrations who are actually completely different people.
Giving two peoples the same name because of where they are living and not based on who they are is non-sensical and mis-leading. We will discuss why the children of Canaan dwelt where they did and who the new people were that moved into their territory when Canaan migrated. All the information one can find on Canaan and Canaanites* in books, papers and online, unknown to the authors themselves, invariably relates to either:
a. other people from Ham’s line;
b. Shem’s descendants;
c. the line of Cain; and
d. the Nephilim.
But incredibly, not the true descendants of Canaan.
Israel a History of – emphasis mine:
‘From Ca’naan came eleven sons, the eldest being Sidon. Sidon founded the city Sidon, and was the progenitor of the Phoenicians. From Heth came the Hittites (Genesis 23:10), who ruled over an empire in Asia Minor for over 800 years. Hittites are very active throughout the entire Old Testament. They were present in Canaan at the time of Abraham, reaching their zenith sometime later in Asia Minor, yet were still a force during the reign of Solomon 1,000 years later (II Chronicles 1:17). Eventually their empire crumbled, and there is evidence that some of the Hittite people fled eastward. Cuneiform monuments record the name “Khittae”, and this may have been modified to Cathay. Archaeologists have noted many similarities between the Hittites and the Mongoloids.’
We will discover that the Phoenicians are descended from Shem and not Ham – Chapter XXIII Aram & Tyre: Spain, Portugal & Brazil; and Chapter XXVII Abraham & Keturah – Benelux & Scandinavia.
True Canaanites had well dispersed by the time the Israelites arrived in Canaan in 1407 BCE. The Phoenicians were a mercantile, shipping and sea people. The original Canaanites were not fond of the sea or boats.
Similarly, Heth was a prominent son of Canaan. Later, notable descendants of Shem became known as Hittites – Chapter XXVIII The True Identity & Origin of Germany & Austria – Ishmael & Hagar.
These Hittites were a war-like people, establishing a powerful empire which rivalled the Assyrians – Chapter XX Will the Real Assyria Stand Up: Asshur & Russia.
Both Empires lived side-by-side in Asia Minor and established an alliance, rather than antagonising each other – Article: Is America Babylon?
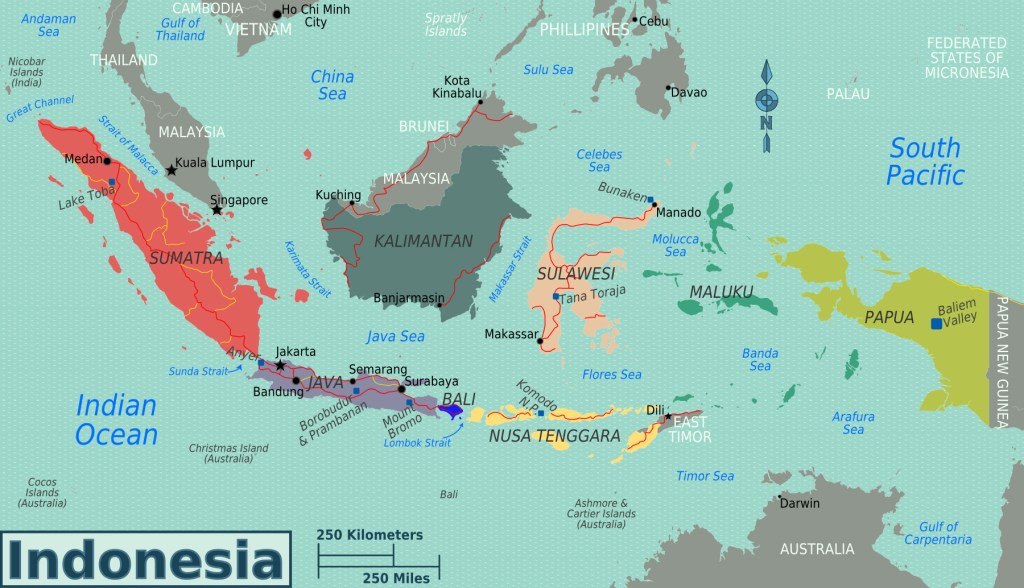
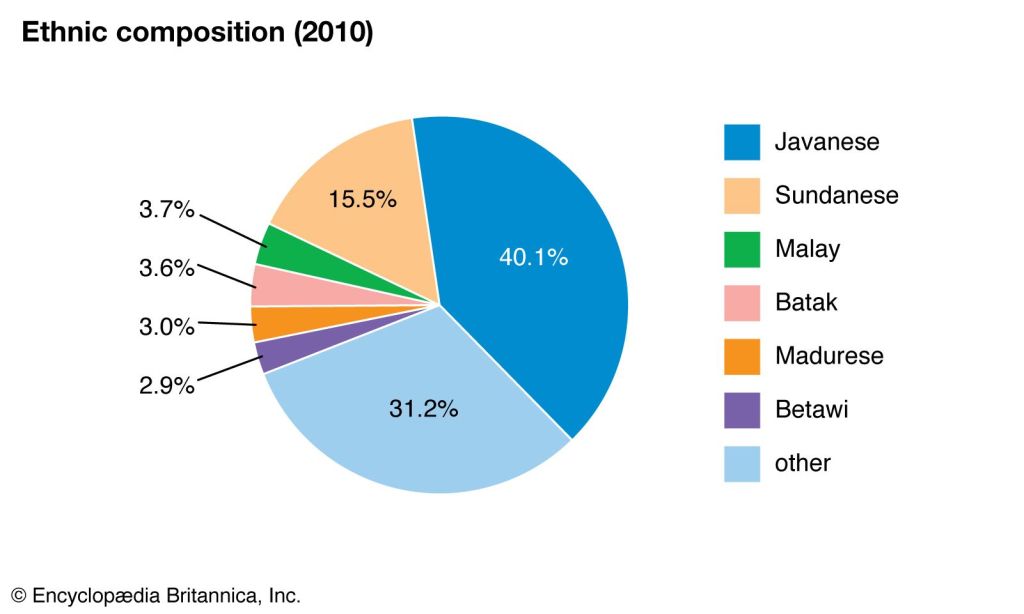
We have discussed earlier how the Khitt-ae are descended from Kittim, a son of Javan and are the Malay peoples of Indonesia today – refer Chapter VIII Kittim & Indonesia.
Additionally, a biological and etymological link between Kittim and the Khitan State in northern China – led by the Liao dynasty from 916 to 1125 CE – is improbable.
The Khittae dwelt in Asia Minor millennia before the Hittites. An earlier people in Anatolia prior to the Hittites – though after the Khittae – were the Hattians. The Hatti, derived from Khatti – a different word – and though easily confused with the Khittae, are an entirely distinct people, descending from Shem – Chapter XXV Italy: Nahor & the Chaldeans.
Israel a History of:
‘The Sinites are an interesting tribe. There is tenuous evidence that they may be the ancestors of the Chinese. Possibly the Sinites migrated east all the way to China. Of the descendants of Ham, Sin and Heth are the two most probable ancestors of the Oriental people. Ca’naan’s descendants, according to scripture, “spread abroad” (Genesis 10:18). Of the lines descending from the sons of Noah, these peoples migrated perhaps more than any other.
The contributions made by the descendants of Ham, the youngest of the sons of Noah, are staggering. They were the first explorers. They became the first cultivators of the basic food groups. They discovered and invented medicines, and surgical practices. They were the first to develop fabrics, and the devices used to sew these fabrics. They were the inventors of mathematics, surveying, and navigation.’
The Chinese descend from Japheth and are East Asian, not Hamitic – refer Addendum II, Chapter X China: Magog, Tubal & Meschech.
The Phoenicians, Hittites and Chinese have not been slaves or subjugated to other nations – refer Chapter XI Ham Aequator.
The peoples described above who travelled extensively and contributed to the advancement of civilisation are the Phoenicians who built the city of Tyre and caused Sidon to flourish, making them world-renowned with their import-export trading interests. We will investigate and identity their descent as being from Shem and not Canaan – refer Chapter XXIII Aram & Tyre: Spain, Portugal & Brazil; and Chapter XXVII Abraham & Keturah – Benelux & Scandinavia.
The Races of the Old Testament, A H Sayce, 1891, pages 55-59 – emphasis mine:
‘Canaan bordered on Egypt, and the name is usually explained to mean the lowlands. It originally denoted, in fact, the narrow strip of land which lies between the sea and the mountains on the coast of Palestine. Here the great cities of the Phoenicians were built, and it was from hence that the Phoenician ships started on their voyages in search of wealth. As time went on, the name of Canaan came to be applied to the land beyond the mountains on the east.
In the letters written from Palestine to the Egyptian court a century before the Exodus, and discovered among the ruins of Tel el-Amarna, Kinakhkhi or Canaan denotes the district which intervened between the cities of the Philistines and the country northward of Gebal. The latter was called the land of the Amorites.
In the books of the Old Testament the word Canaan has acquired an even greater extent of meaning than it has in the tablets of Tel el-Amarna. The cities of the Philistines, as well as the barren region east of them, are alike included in Canaan. Even the Amorites have become Canaanites, like the inhabitants of Hamath far away to the north.’
Canaan is mentioned many, many times in the Bible, not in reference to their people but the land they first settled, that in time became busier than ‘grand central station’ in terms of human traffic and the varying numbers of nations who dwelt in the region for millennia.
Sayce:
‘The original land [actually much later] of Canaan was called Phoenicia by the Greeks and Kaftby the Egyptians. It is possible that both names were derived from the palms which grew luxuriantly there. Kaph and Kipptih signify a palm-branch in Hebrew, and phoenix in Greek has the same meaning. But it is also possible that the latter word was derived from the name of the country in which the Greeks first became acquainted with the palm, not that the country took its name from the tree.
The language of Canaan, as it is called by Isaiah [19:18], differed but slightly from Hebrew. The Hebrew tribes, in fact, like their kindred in Moab and Ammon, must have exchanged their earlier Aramaic dialects for the language of the country in which they settled. In no other way can we explain how it came about that the Syrian emigrant [Deuteronomy 26:5] should have acquired the ancient language of Canaan. The adoption of the new language was doubtless facilitated by the relationship of the Aramaic dialects to Hebrew or Phoenician.
They belonged to the same family of speech and bore the same relation to one another that French bears to Italian.’
Interesting and coincidental observation regarding language, which we will re-visit when studying Aram and Moab – refer Chapter XXIII Aram & Tyre: Spain, Portugal & Brazil, Chapter XXV Italy: Nahor & the Chaldeans; and Chapter XXVI The French & Swiss: Moab, Ammon & Haran.
Sayce:
‘It will be seen that the tribes and cities of which Canaan is said to have been the father were related to one another only geographically. The blond Amorite and the yellow-skinned Hittite [rather Khittae] of the north had nothing in common from a racial point of view either with one another or with the Semitic tribes of Canaan. Geography and not ethnology has caused them to be grouped together.’
Sayce hits upon the key point regarding Canaan. The blond Amorites are not the descendants of Amor, the son of Canaan. All the information we read regarding Canaan in extraneous material and in the Bible after Abraham and certainly by the time the descendants of Jacob – the Israelites – arrived in stages between circa 1900 to 1400 BCE; witnesses a change in who the actual Canaanites were. The original Canaanites had departed for Africa and other Canaanites* had moved into the vacated strip of land, or had forced the true Canaanites southwestwards.
It was a lucrative piece of real estate with its rich soil and farm land, beautiful landscapes and extensive ports. There were numerous peoples who converged and those who were evil – the Nephilim descended Elioud giants and those who had intermarried with them, by default – fell to the descendants of Jacob during the waging of a monstrous war for seven years to clear the land after they entered in 1407 BCE – Appendix VII: Moses, the Exodus & the Red Sea Crossing – Fabrication or Fact?
An online encyclopaedia, accurately states the multiculturalism and the variety of ethnicities incorporated under the ‘Canaanite’ umbrella during this intermediate period; with the incorrect ascribing of the term Phoenician from an ethnic vantage, yet accurate from a geographic perspective – emphasis mine:
‘The name “Canaan” appears throughout the Bible, where it corresponds to the Levant, in particular to the areas of the Southern Levant that provide the main setting of the narrative of the Bible: Phoenicia, Philistia, Israel, and other nations.
The word “Canaanites” serves as an ethnic catch-all term covering various indigenous populations.
It is by far the most frequently used ethnic term in the Bible. The name “Canaanites” is attested, many centuries later, as the endonym of the people later known to the Ancient Greeks from c. 500 BC as Phoenicians, and after the emigration of Canaanite-speakers to Carthage (founded in the 9th century BC), was also used as a self-designation by the Punics (chanani) of North Africa during Late Antiquity.’
The Origin of the Nations, Herman Hoeh, 1957 – emphasis mine:
‘Originally the sons of Canaan settled in Palestine. Canaan, remember, was the first born of Ham [Canaan is Noah’s youngest son – refer Chapter XI Ham Aequator]. Canaan’s descendants – and this includes the other sons of Ham [incorrect, Genesis 9:25-27] – were to be “servant of servants” (Genesis 9:25) [Genesis 9:25 states Canaan not Ham]. Their children are to serve both Shem and Japheth (verses 26,27).
There is nothing wrong with serving – we all have to learn to serve [Note: difference between serving, servitude and slavery]. Shem and Japheth must become God’s servants, too. That is why Canaan is called a “servant of servants.” Many have quoted this in direct reference to the [Black African]. As brothers of Canaan, the [Africans] have shared the same position in life, but [Africans] are not Canaanites.’
Dr Hoeh has confidently stated his position, firstly, based on the later ‘Canaanite’ peoples and the ‘trafficking’ (trading) of the Phoenicians – very understandable, yet incorrect. And secondly, to distance himself from the thorny issue of equating the Black peoples with Canaan – particularly at time of writing in 1957 America.
Herman Hoeh:
‘The Canaanites were great traffickers of old. The word Canaanite in Zechariah 14:21 is, in fact, translated as “trafficker” in the Jewish translation. The Sidonians, descendants of Canaan, were famous seamen in the days of Solomon. The Greeks called them “Phoenicians”. But the Phoenicians called themselves “Kna” or “Knana”, meaning Canaanite.’
From a historical time-line perspective, the original Sidonians were linked to Canaan, who were not sea-traders; the intermediate Sidonians linked to Aram were the original Phoenicians, descending from a son of Shem; and the later Sidonians were linked with Midian, another successful trading people and a son of Abraham. The Phoenicians lived in Canaan as the collective area was known, hence their identification with this name – it was they who were the ‘famous seamen.’
Hoeh:
‘When Israel entered the land of Palestine under Joshua, whole tribes of the Canaanites were destroyed or driven out of central Palestine (Judges 3:1-4) because some of the Canaanites were extremely degenerate in their morals. Now turn to Genesis 10:18, “Afterward were the families of the Canaanites spread abroad”. Where did they journey?’
The ‘extremely degenerate’ Canaanites at this time, which the sons of Jacob encountered, were not the original sons of Canaan but the Nephilim descended Elioud giants who had infiltrated the land. We will cover this subject in-depth in later sections – refer Chapter XXI The Incredible Origin, Identity and Destiny of Nimrod; Chapter XXII Alpha & Omega; and articles: Nephilim & Elioud Giants I & II.
Hoeh:
‘The Canaanites settled the island of Malta and parts of Sicily, Southern Italy, Sardinia, North Africa and even Southern Spain and Portugal, where the sons of Javan were already living [The sons of Javan had long gone – refer Chapter VII Javan: Archipelago South East Asia & Polynesia].
Most people are familiar with the Phoenicians from grade and high school days. In North Africa the Canaanites are called Moors – a name probably derived from Amors, the Hebrew form of “Amorites”. From these lands they have spread into North and South America since the days of Columbus. The Portuguese – of mixed Canaanite and Tarshish stock – have settled much of Brazil. And the Sicilians are [well known] in big cities in America. The underworld “Mafia” organization which springs from Canaanitish Sicily, is but a modern version of their ancient tendency to traffic among the nations of the world.
Canaanites have also intermarried into Esau – Turkey today (Genesis 26:34), and Judah (Genesis 38:2), and Israel (Judges 3:5-7). Only a few Canaanites remain in North Palestine and Lebanon. The [true] Canaanites are seldom included in the prophecies which pertain to this twentieth century. They exert no great position or influence in the world.’
Esau’s ‘Canaanite’ wives were not true Canaanites but – as stated earlier of the four options for non-Canaanite* peoples a, b, c and d – they were from d. Nephilim families – refer Chapter XXIX Esau: The Thirteenth Tribe.
Judah did take a wife from the original Canaanites. The Israelites as mentioned in the Book of Judges took wives from later Canaanites from b. Shem’s descendants. We will learn that the Latins of Europe – such as the Portuguese and Sicilians mentioned by Hoeh – are descended from Shem and not from Japheth or Ham. The majority of Latino-Hispano Americans are descended from a. Shem and b. Ham; but not from Canaan, as is also true of the Moors and the Arab peoples of the Lebanon and Palestine – Chapter XIV Mizra: North Africa & Arabia.
Another fascinating coincidence has occurred, with regard to the Portuguese and Brazil, which we will return to in a later chapter.
The original meaning of Canaan was different. The term ‘trafficker’ and the link to trade, was applied to Canaan the land and the people living in Canaan later and not to the original Canaanites.
Herman Hoeh states the brother(s) of Ham have ‘shared the same position in life’. The Bible reveals that Canaan was to be a servant people, not Ham or any of the other three half-brothers of Canaan. Herman Hoeh ironically, while denying the simple truth of the Canaanites classification, in the process, reveals the true identity of Canaan.
For they are the Black peoples of Eastern, Central, Western and Southern sub-Sahara Africa; while including those non-Arab related peoples residing in Northern Africa.

Matthew 18:1-5
New English Translation
‘At that time the disciples came to Jesus saying, “Who is the greatest in the kingdom of heaven?” 2 He called a child, had him stand among them, 3 and said,
“I tell you the truth, unless you turn around and become like little children, you will never enter the kingdom of heaven!
4 Whoever then humbles himself like this little child is the greatest in the kingdom of heaven. 5 And whoever welcomes a child like this in my name welcomes me.’
One should like to think a child who has a basic understanding of world history, having learned about the slave trade, would… if presented with the question:
Which people in the world have endured untold hardships, extremes of poverty and the severest of suffering at the hands of slave traders, throughout recorded history?
… quickly offer the Black descended people of Africa as their answer.
It has been in the scriptures, right in front of us for a very long time.
Luke 7:35
New English Translation
35 ‘But wisdom is vindicated [or shown to be right ] by all her children [by all those who follow her].’
It is a highly sensitive issue and many are reticent to vocalise the palpable truth; so as to escape the vitriolic criticism which could inevitably ensue. Not speaking the undeniable, doesn’t alter it or make it disappear.
Granted, it is a harshness beyond compare, how a whole lineage of people could be punished because of one man’s transgression; though we do not see all the pieces of the puzzle put together as the Creator does.
The reality is that the Black peoples have suffered immeasurably at the hands of the British, Americans, Dutch, Portuguese, as well as the Arabs before them in recent history and as recorded in the Bible; at the hand of the Egyptians – per the El Amarna tablets circa 1500 BCE.
African tribes have continuously waged war against each other with horrific violence, making slaves of each other, cannibalising one another. There has been no rest for the descendants of Canaan and it continues to the present day, where in the main, African governments and regimes ruthlessly and relentlessly, brutally subjugate their own people.

As tragic as the taking of people from their families and homes was and transplanting them in the New World of America, the Caribbean and Brazil, with dangerous, deadly ocean crossings and often savage masters; it has resulted for future generations of African Americans to have at least a chance of a life of opportunities, far greater than their fellow peoples – those living on the African Continent today.
This writer empathises with all the descendants of African Americans who have not benefited in being transplanted from their homeland and if history could be rewound, this reason alone would be enough cause to turn back time.

So while there is a concerted effort by some (as above) to either reject, ignore, hide or deny the truth… the fact remains, the ‘Bible is clear’ in that the peoples of Africa (in the main) are the descendants of Canaan.
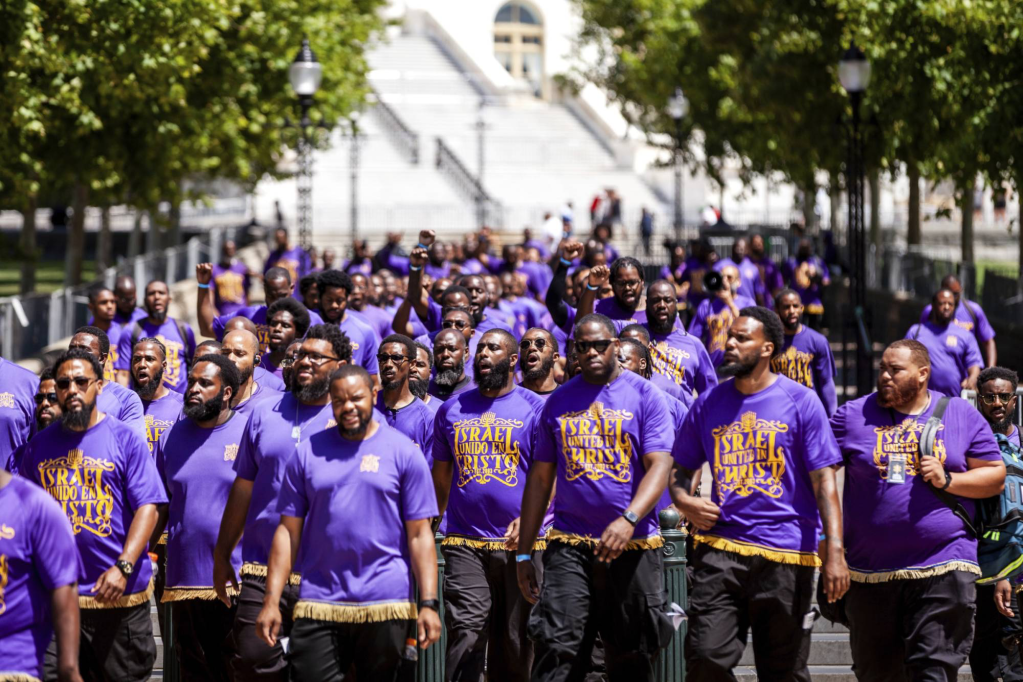
They are not descended from Cush for example or a lineage of Jacob (Israel) including Judah; as advocated by the Black Hebrew Israelites (above). Note the colour purple.
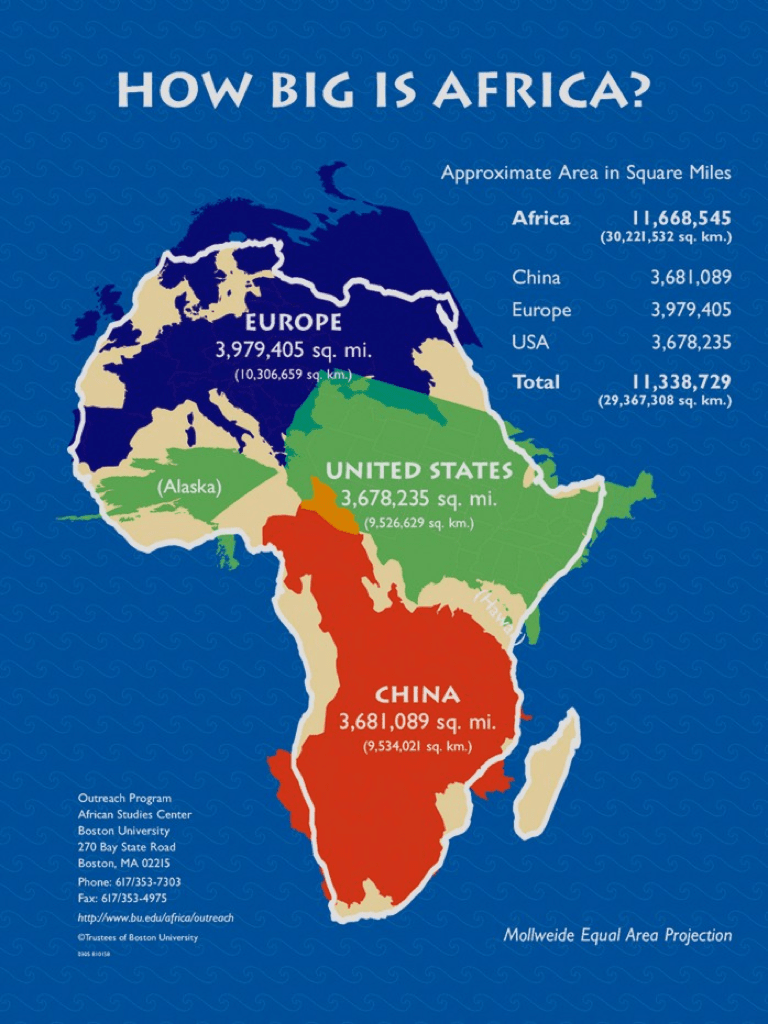
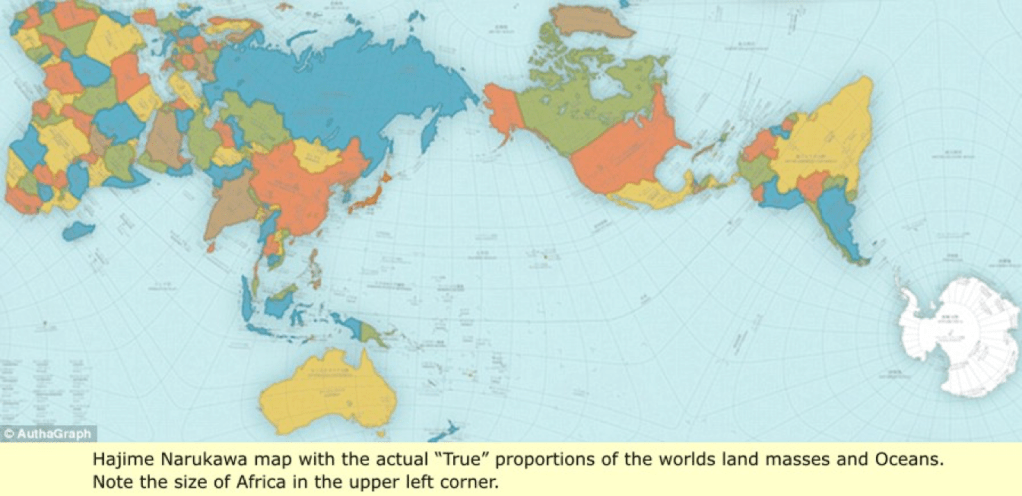
Africa is vast, with immense natural resources.
In the top ten countries with the most natural resources which China tops, one African nation is included at number nine; the Democratic Republic of Congo. Mining is the primary industry of the DRC. It is estimated that the country has over $24 trillion in mineral deposits including the largest coltan reserve and vast amounts of cobalt. The DRC also possesses large copper, diamond (21% of Global production in 2019), gold, tantalum, and tin reserves, along with over three million tons of lithium.
Both Lithium and cobalt are integral ingredients for batteries in electric vehicles – refer article: Climate Change & Global Warming – Looming Crisis or a New Equilibrium?
The severity of the punishment handed down to the Canaanites stopped short with them and seemingly did not include their inherited possession of territory. Yet, ‘Africa has been equally cursed and blessed by its resources – blessed in so far as it has natural riches in abundance, but cursed because outsiders have long plundered them. In more recent times the nation states have been able to claim a share of these riches, and foreign countries now invest rather than steal, but still the people are rarely the beneficiaries’ – Prisoners of Geography, Tim Marshall, 2016 & 2019, page 131.
Regarding Canaan’s name, there is somewhat of a conflict, between what the word actually means and what it became associated with. Strong’s Concordance H3667 includes:
merchant, traffic, traffickers, trader, Lowland and from the root H3665, humiliated.
Canaan, as inferred by several commentators, was to be a ‘servant of servants’, ‘humbled, subdued’ and ‘subjugated’. The land of Canaan was low lying and it became synonymous with merchants and trafficking of goods. Saying that, Canaan as a people were also trafficked and treated as merchandise.
Abarim Publications – emphasis theirs:
‘For a meaning of the name Canaan, NOBSE Study Bible Name List reads Low. Jones’ Dictionary of Old Testament Proper Names reads Merchant or Servant… We would interpret the name Canaan as International Trade or International Synchronicity… From the verb (kana), to be brought into synchronicity.’
The name ‘Kenan’ first came to this writer’s attention when the television sitcom Kenan & Kel aired in the late 1990s.

While Kenan – meaning ‘possession’ – is not widely recognised as a popular African American name, it is ‘part of a broader trend where names of Hebrew origin are embraced within African American culture. Kenan has biblical roots and is mentioned in the Book of Genesis. Its unique meaning and cultural roots contribute to its appeal.
The name reflects a connection to heritage and identity…’
And so it does in a remarkable way, yet which is lost on the majority.
Canaan can also mean the ‘land of purple’ from the term kinahnu: purple dye. The colour purple became associated with the Phoenicians. It is an interesting coincidence that The Color Purple is the title of Alice Walker’s 1982 novel and subsequent Steven Spielberg film. The story is about African American gender, race and nationhood.

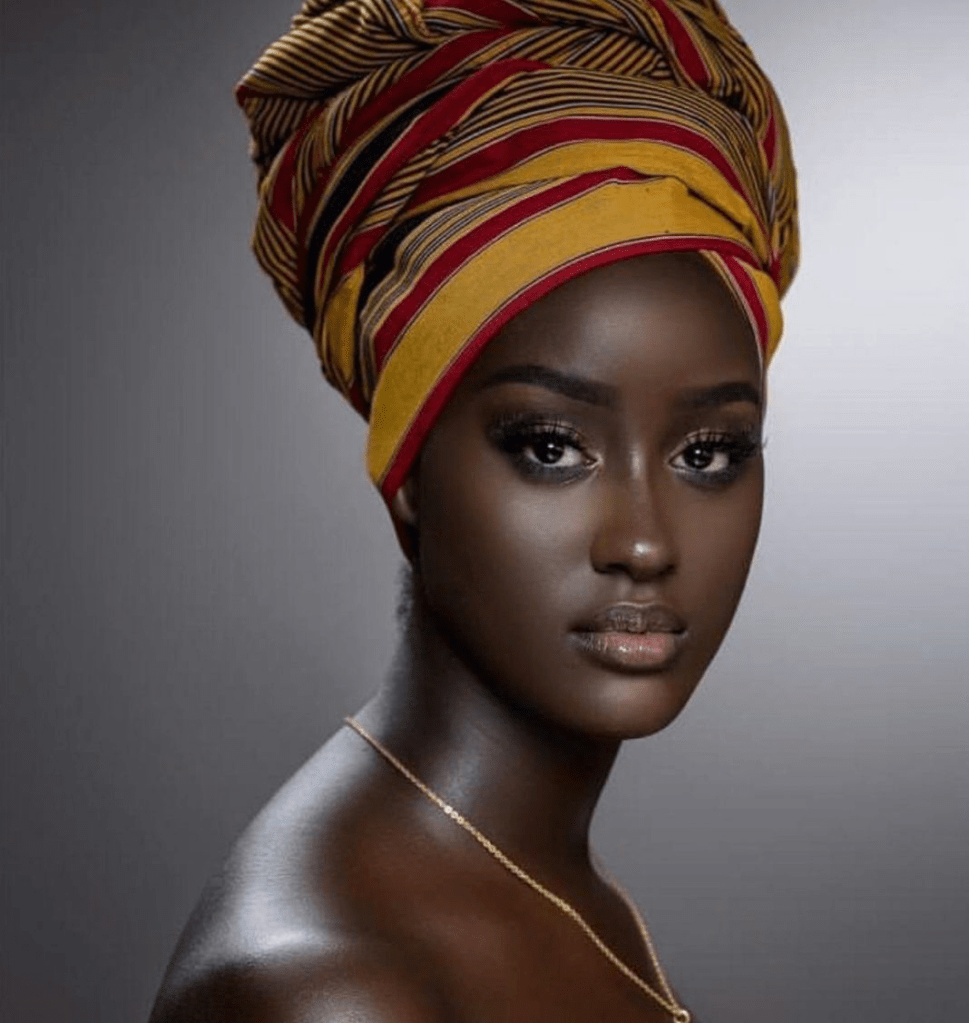
The link with purple to Canaan’s descendants is insightful, as evidenced by the propensity of African Americans (and Africans) in favouring various shades of purple in their attire.

An African wedding with the bride and groom wearing royal purple
The colour purple is associated with the following lofty traits, invariably denied to Canaan but no less desired.
Bourne Creative – emphasis mine:
‘Purple combines the calm stability of blue and the fierce energy of red. The color purple is often associated with royalty, nobility, luxury, power, and ambition. Purple also represents meanings of wealth, extravagance, creativity, wisdom, dignity, grandeur, devotion, peace, pride, mystery, independence, and magic.’

‘The color purple is a rare occurring color in nature and as a result is often seen as having sacred meaning. Lavender, orchid, lilac, and violet flowers are considered delicate and precious. Throughout history, purple robes were worn by royalty and people of authority or high rank…the rare occurrence of purple in nature made it one of the most expensive color dyes to create.’

Speaking of colour, the amount of melanin a person has dictates not only the shade of their skin.
Rastafari: The Truth About Melanin – emphasis mine:
‘Melanin refines the nervous system in such a way that messages from the brain reach other areas of the body [more] rapidly in Black people… Black infants sit, stand, crawl and walk sooner than [white infants], and [demonstrate] more advanced cognitive skills than their white counterparts… Carol Barnes writes “… your mental processes (brain power) are controlled by the same chemical that gives Black humans their superior physical (athletics, rhythmic dancing) abilities. This chemical… is Melanin!”
The abundance of Melanin in Black humans produces a superior organism physically… Melanin is the neuro-chemical basis for what is called [Soul] in Black people. Is God Black? The Original Man was [black], “made in the Image of God” his Parent. Children look like their parents. All the other races are but diluted variations of the Original Black Race.’
This raises some key points.
When studying Noah, we established that the Ancient of Days and the Son of Man are described as white in the Bible – refer Chapter I Noah Antecessor Nulla.
The same is written in the Book of Enoch chapter 46:1-3.
1 At that place, I saw the One to whom belongs the time before time. And his head was white like wool, and there was with him another individual, whose face was like that of a human being. His countenance was full of splendor… 2 And I asked the one… who had revealed to me all the secrets… “Who is this… 3 And he answered me and said to me, “This is the Son of Man, to whom belongs righteousness, and with whom righteousness dwells. And He will open all [that is] hidden… for Yahweh of Hosts [Ancient of Days] has chosen Him, and He is destined to be victorious before Yahweh of Hosts in eternal uprightness.”
We will look further in to man being the image of God. There is a link to the colour black as this author states; just not quite the answer one would expect – refer article: Asherah.
Rastafari:
‘Most [white people] have calcified pineal glands which thwarts Melatonin production, thereby limiting their [spiritual]* capacity. Located in the brain, the tiny pineal [and] pituitary glands regulate the body’s other glands’ – refer article: 33.
‘Esoteric tradition regards the area of these glands as the third eye, seat of the soul, and the mystical Uraeus represented by the cobra on the forehead of Egyptian [royalty’s] crowns.’
A succinct definition online:
‘Uraeus is an important symbol associated with the Gods, Goddesses, and Pharaohs of ancient Egypt. It is represented by the image of an upright cobra in a threatening pose and is believed to have its origins in Iaret, an Egyptian word meaning the risen one.
The icon symbolized divine authority, royalty, sovereignty, and supremacy and was worn as a crown or head ornament by the ancient Egyptian divinities and rulers. This sacred serpent symbol reiterated the connection between the Gods and the Pharaohs and wearing the Uraeus conveyed legitimacy to the royal personage.
The rearing cobra indicated that the ruler enjoyed the protection and patronage of Goddess Wadjet, the Lower Egypt deity [Article: Thoth].
After the unification of Egypt, the Uraeus was depicted together with the Vulture, which was the symbol of Nekhbet, the patroness of Upper Egypt [refer vulture; Gobekli Tepi, article: Monoliths of the Nephilim].
The merged symbol was called ‘The Two Ladies’, the joint protectors of the country’ – Article: The Pyramid Perplexity.
Rastafari:
‘Why did Africans view the European as a child of God, but the Europeans viewed the African as a soulless savage? Because of “melatonin,” described as a mentally and morally stimulating humanizing hormone produced by the pineal gland. Scientific research reveals that most [white people] are unable to produce much melatonin because their pineal glands are often calcified and nonfunctioning.
Pineal calcification rates with Africans is 5-15%; Asians 15-25%; Europeans 60-80%!
This is the chemical basis for the cultural differences between [blacks] and whites, causing some Black scholars to raise the question that the European approach, that of the logical, erect, rigid, anti-feeling posture, reflects a left brain orientation and reflects that they lack the chemical key of melatonin to turn on their unconscious and… feelings. Melanin [gives] humans the ability to [feel] because it is the absorber of all frequencies of energy.’
A case in point, is the faith* which Black people exhibit towards their Saviour and their exuberance and passion in church congregations. This has often produced thoughts of respect and a little jealousy towards their genuine peace and joy.
Rastafari:
‘After considering Melanin to be a “waste” product of body-metabolism which “served no useful function,” … science has now discovered that Melanin is the chemical key to life and the brain itself! All studies and facts about Melanin suggest that after 400 years of attempting to make [the Black race inferior], “Western science is facing the sobering reality that, by its own self-defined standards, Black people are probably superior to whites in both intellectual potential and muscle coordination.” (Sepia magazine interview).
In humans, melanin is the primary determinant of skin and hair color.
However, few people know that melanin is found in almost every organ of the body and is necessary for the brain and nerves to operate, the eyes to see, and the cells to reproduce.
It is also found in the stria vascularis of the inner ear. In the brain, tissues with melanin include the medulla and pigment-bearing neurons within areas of the brainstem, such as the locus coeruleus and the substantia nigra. It also occurs in the zona reticularis of the adrenal gland.
Exposure to the sun has the potential to cause premature aging of the skin, as well as various skin cancers. [The] ability to withstand the potentially damaging effects of the sun’s ultraviolet radiation depends on the amount of melanin in your skin, which is determined by the number of melanocytes that are active beneath the surface… Melanin is an effective absorber of light; the pigment is able to dissipate more than 99.9% of absorbed UV radiation. In even the most light-skinned people, the body’s melanocytes respond to sun exposure by producing more melanin, which creates the effect known as tanning. However, there is a limit to the degree of protection that melanin can provide, and it’s significantly higher in people with naturally darker skin.
Melanin can absorb a great amount of energy and yet not produce a tremendous amount of heat when it absorbs this energy, because it can transform harmful energy into useful energy. According to dermatologist and dermapathologist Dr. Leon Edelstein, director of the National American West Skin Pathology Consultation Service, melanin can absorb tremendous quantities of energy of all kinds, including energy from sunlight, x-ray machines, and energy that is formed within cells during the metabolism of cells. His theory is that melanin has the ability to neutralize the potentially harmful effects of these energies.
Darkly pigmented people tend to exhibit less signs of aging. Dermatologist Susan C. Taylor, author of “Brown Skin,” points out that Blacks and other people of color generally look younger than their lighter-skinned peers because of the higher levels of melanin in their skin. The dark pigmentation protects from DNA damage and absorbs the right amounts of UV radiation needed by the body, as well as protects against folate depletion.
Folate is water soluble vitamin B complex which naturally occurs in green, leafy vegetables, whole grains, and citrus fruits. Women need folate to maintain healthy eggs, for proper implantation of eggs, and for the normal development of placenta after fertilization. Folate is needed for normal sperm production in men. Furthermore, folate is essential for fetal growth, organ development, and neural tube development. Folate breaks down in high intense UVR. Dark-skinned women suffer the lowest level of neural tube defects.’
‘Dr. Frank Barr, pioneering discoverer of melanin’s organizing ability and other properties, theorizes in his technical work, Melanin: The Organizing Molecule:
“The hypothesis is advanced that (neuro)melanin (in conjunction with other pigment molecules such as the isopentenoids) functions as the major organizational molecule in living systems. Melanin is depicted as an organizational “trigger” capable of using established properties such as photon – (electron) – photon conversions, free radical-redox mechanism, ion exchange mechanisms, and semiconductive switching capabilities to direct energy to strategic molecular systems and sensitive hierarchies of protein enzyme cascades. Melanin is held capable of regulating a wide range of molecular interactions and metabolic processes…”

The map of former African colonies below is a grim picture. To be clear, the African people have suffered because of their forefather Ham, his wife Na’eltama’uk and their actions; not, because the Black people are inferior to any other ancestry group and ethnic line, or because they have brought suffering on themselves. Black people are not lesser to any other race of people on the Earth.

Nor do they deserve any kind of racial discrimination for their ethnic characteristics and colour of their skin.

Abarim Publications – emphasis mine:
‘In the Greek New Testament the name Canaan is spelled Χανααν [Acts 7:11 and 13:19] and Canaanite (female) is spelled Χαναναια (Matthew 15.22]. The masculine form Χαναναιος does not occur in the New Testament but both Matthew and Mark make mention of a Simon the Kanaanite (Κανανιτης; [Matthew 10:4, Mark 3:18]).
The name Canaan may have been original – meaning “land of purple,” says HAW Theological Wordbook of the Old Testament, which relates it to Phoenicia, also meaning purple – and turned proverbial, but it may also have been taken from the Hebrew verb (kana) and projected back upon this person… The verb (kana) means to synchronize, or to give up individual leanings in order to unite more effectively as a group. Noun (kin’a) means bundle or pack.’
A further irony, as the sons of Canaan have not been a unified people and their leaders have not given up individual leanings.
Abarim:
‘The Old Testament’s passion for reaching the “land of Canaan” may have a very clear connotation of reaching the blissful situation of international synchronicity. Being located on the bridge between three continents, the [intermediate] historical people of Canaan maintained a flowering culture of trade. Thus the words, meaning Canaan, and, meaning Canaanite, acquired the additional meaning of trade or merchant (Zephaniah 1:11, Ezekiel 16:29).’
The original allotment of land running north-south on the furthest eastern coast of the mediterranean – or the far west coast of the fertile crescent – had been designated for Shem’s sons. Canaan’s descendants had dwelt there before migrating southwest to Africa. Ultimately, the sons of Jacob also migrated away from this strip of land.
In the Book of Jubilees chapter ten, verses 28-33, we read about Canaan after the Flood, when land was apportioned to Japheth Ham and Shem, in the wider Near and Middle Eastern region. Recall, Madai in chapter four, requested to live adjacent to Shem’s descendants – Chapter IV Central Asia – Madai & the Medes.
‘And Ham and his sons went into the land which he was to occupy, which he acquired as his portion in the land of the south. And Canaan saw the land of Lebanon to the river of Egypt [the Nile], that it was very good, and he went not into the land of his inheritance to the west (that is to) the sea [North Africa], and he dwelt in the land of Lebanon, eastward and westward from the border of Jordan and from the border of the sea.
And Ham, his [step]father, and Cush and Mizraim his brothers said unto him:
“Thou hast settled in a land which is not thine, and which did not fall to us by lot: do not do so; for if thou dost do so, thou and thy sons will fall in the land and (be) accursed through sedition; for by sedition ye have settled, and by sedition will thy children fall, and thou shalt be rooted out for ever. Dwell not in the dwelling of Shem; for to Shem and to his sons did it come by their lot. Cursed art thou, and cursed shalt thou be beyond all the sons of Noah, by the curse by which we bound ourselves by an oath in the presence of the [Holy Judge], and in the presence of Noah our father.”
But he did not harken unto them, and dwelt in the land of Lebanon from Hamath* to the entering of Egypt…’
Canaan’s three [half]brothers all migrated to northern Africa and the horn of Africa. Canaan followed later as predicted, settling in North West Africa. Ultimately, two brothers left Africa and two remained. One being Canaan, who eventually spread southward throughout Sub-Saharan Africa.
We read in Genesis 10:15-18 ESV, of the sons of Canaan:
‘Canaan fathered Sidon his firstborn and Heth, and the Jebusites, the Amorites, the Girgashites, the Hivites, the Arkites, the Sinites, the Arvadites, the Zemarites, and the Hamathites.*
Afterward the clans of the Canaanites dispersed.’
In other words:
Sidon, Heth, Jebu, Amor, Girgash, Hiv, Ark, Sin, Arvad, Zemar and Hamath.
The endeavour to identify all eleven of Canaan’s lines of descendants – as there are some fifty-four plus African nations containing Canaan’s offspring – for now, remains a future project. We will concentrate on Sidon the firstborn and Heth the second born, who are each prominent lineages.
Insight into Canaan’s sons is provided by Professor Aaron Demsky, in Reading Biblical Genealogies – Including a close look at how the description of the Canaanite lineage was constructed (Genesis 10:15-18) – emphasis & bold mine:
‘The Sons of Canaan… include twelve names. In order to come up with twelve Canaanite sons – another typological number implying a full people (see below) – it needed to include different kinds of names.
… Six of the names are ethnic names, known from the lists of the indigenous Canaanite peoples, that appear either in part or in full some twenty-five times in the Bible.
Three of these terms are the externally documented: Canaanites, Amorites and Hittites.
The rest are unknown in non-biblical texts: Jebusites, Girgashites and Hivites. The [Perizzites], who appear in a number of these lists, are not mentioned here.
… The list also includes five Phoenician-Syrian city-states as part of the Canaanite league:
1. Sidon along the coast,
2. ‘Arqa (Tel ‘Arqa, ca.20 kms north east of Tripoli) [Ark]
3. Sin (Shian in the Assyrian sources; in later Jewish documents it is identified with Tripoli in Lebanon)
4. Arwad (Ruad, an island port between Tripoli and Latakia) [Arvad]
5. Ṣemer (Assyrian Ṣumur, south of Arwad) [Zemar]
6. Hamath (Ḫama one of the major cities in middle Syria), situated on the Orontes.
The names of these “sons” are not presented uniformly.
1. The first three – Canaan, Sidon and Heth – are proper names.
2. The “descendants” are written as gentilics (i.e., relational adjectives in the nisbe form) with the definite article (the Jebusite, the Amorite), etc. Canaan also appears in this form at the end of the list.
Chiastic Form
The “descendants” are listed in chiastic order. Sidon is the firstborn followed by Heth. Following Heth are the other five Canaanite peoples, related to Heth, and then the five city states, obviously related to Sidon, as they are all Phoenician city-states like Sidon…
The Significance of Twelve
As we see from the later genealogies of Nahor (Genesis 22:20-24), Ishmael (Genesis 25:13-15), and of course, Jacob, twelve is a significant number in biblical tradition for classifying large ethnic units, or tribal leagues, in the patriarchal period [Article: Seventh Son of a Seventh Son].
In this case of Canaan, however, we find a certain creativity in order to produce the desired number. The list has two anomalies:
1. The patriarch here is one of the twelve.
2. Five city-states (or feudal kingdoms) have been recast as clan units.
As noted above, the larger branches of the three sons of Noah are defined not only by ethnicity and language affinity, but also by geographic proximity (verses 5, 20, 31).
Moreover, emphasizing the integral territorial aspect of tribal identity, sundry geographical notices were appended, e.g., verses 10-12; 30. Similarly, in verse 19, this genealogy of Canaan is enhanced by a fascinating geographic description of the borders of Canaan (verse 19):
The Canaanite territory extended from Sidon as far as Gerar, near Gaza, and as far as Sodom, Gomorrah, Admah, and Zeboiim, near Lasha. This description serves both to minimalize Canaanite territory and to introduce places that will appear in later narratives.
Northern Border – Phoenician Cities
Following a three pointed pattern of delineating borders, which I have identified, i.e., “From X, coming to Y, near Z”, the list begins with Sidon, which probably now implies the entire Tyrean kingdom on the Phoenician coast from Acco in the south to Nahr Kalb in the north (Joshua 13:4-6; compare the territory of Asher 19:24-30).
South-Western Border – Philistine Cities
The second point, on the south-western border of Canaan, Gerar (Tel Harur, present day Netivot on Nahal Gerar, i.e. biblical Nahal HaBesor), was defined by the third point Gaza, some 20 kms away. This description of the southern border of Canaan serves another literary purpose by anticipating the stories of Abraham and Isaac going to Gerar and the story of Jacob’s funeral cortège from Egypt to Hebron at the end of the book (Genesis 50:10-11).
Eastern Border – The Dead Sea and the Five Cities
From the south western corner of the Land, the border goes to the southern edge of the Dead Sea. The description introduces the five cities [technically only four, as Lot escaped to Zoar and it was spared] which are eventually destroyed in the story of Lot and Sodom.’
Twin groupings for the descendants of Canaan, as proposed by Demsky.
Cities: Sidon, Ark, Sin, Arvad, Zemar and Hamath
Clans: Heth, Jebus, Amor, Girgash, Hiv, (Canaan)
According to Demsky, the clans are the literal sons of Canaan and – amongst other places – they lived in the aforementioned cities.
This position seems to create further questions. How did these six cities acquire their names? It would seem plausible they are so named after their founders. ‘They’ being the first and seventh to eleventh sons listed in Genesis chapter ten. Is an extra Canaan applicable and if so, is he Canaan junior or possibly a grandson of Canaan senior?
The cities of Ark, Sin, Arvad, Zemar and Hamath have been included for a reason and while perhaps not sons names, became synonymous with sons from the clan list.
Support for this premise is that
a. Heth and Hiv (and perhaps Amor) unarguably became names attributed to Shem’s descendants, while Jebus and Girgash are not so clear; and
b. Ark, Sin and Zemar are not discussed prophetically, though Arvad, with Hamath (and Sidon) are and have become identifiable people in the world today.
Therefore it is proposed that there are six key lineages for Canaan’s descendants which are formed from pairs comprising a clan and a city. Three of them are prominent and will be discussed below.
There are a fair number of scriptures for some of the cities and sons, so we will look at a sample. The majority refer to ‘Canaanites’ during a later period where the original sons of Canaan were not living and so are discounted in this chapter.
The Book of Jasher 7:13 includes additional or duplicate names, totalling ten sons instead of eleven, with Jebus missing:
And the sons of Canaan were Zidon, Heth, Amori, Gergashi, Hivi, Arkee, Seni, Arodi [Arvad?], Zimodi [Zemar?] and Chamothi [Hamath].
Sidon, or Zidon in Hebrew means: ‘fishery, hunting place.’
From the verb sud, to hunt or fish. The noun mesad means fastness or stronghold – a typically defensive structure. ‘Sud’ in French means south.*
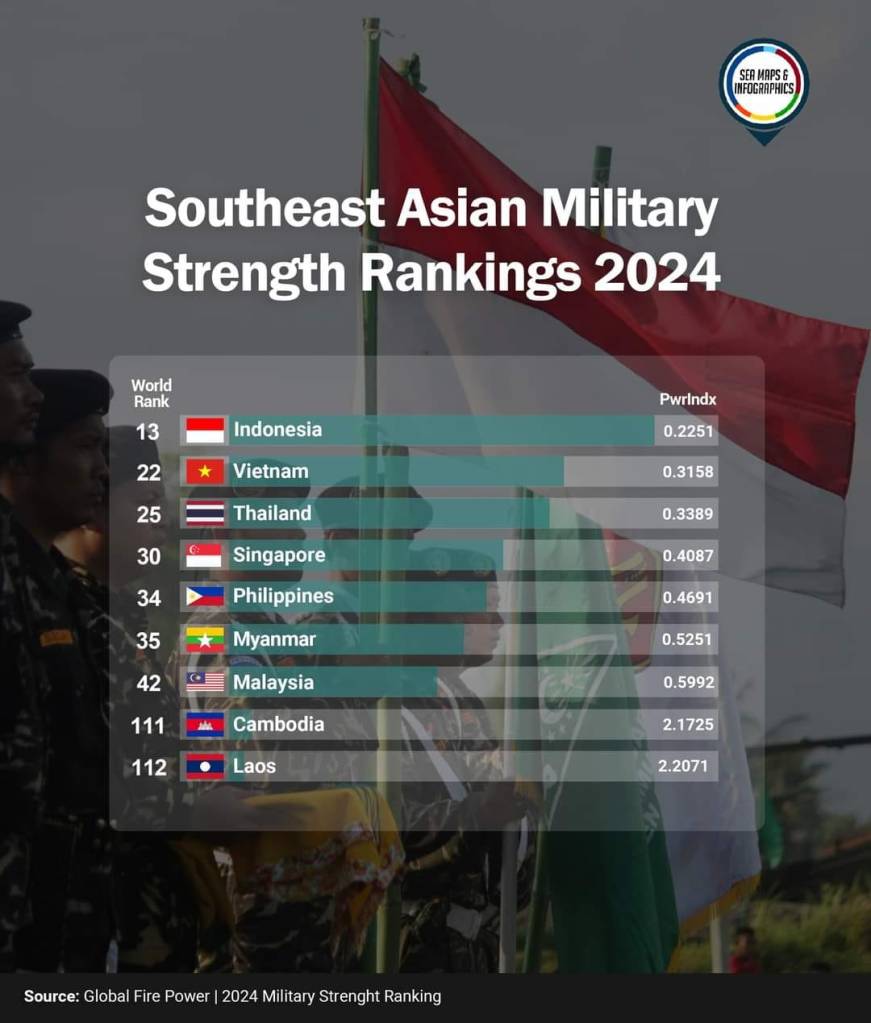
When studying Javan’s son Kittim – refer Chapter VIII Kittim & Indonesia – a key economic, geographic maritime, port people; we looked at Isaiah chapter 23. There are additional major nations in a similar key geographic harbour location.
Isaiah 23:1-3
Complete Jewish Bible
A prophecy about Tzor [Tyre-Brazil]:
Howl, you “Tarshish” [Japanese] ships, because the harbor is destroyed! On returning from Kittim [Indonesia], they discover they cannot enter it. 2 Silence, you who live on the coast, you who have been enriched by the merchants of Tzidon [Sidon] crossing the sea. 3 By the great water the grain of Shichor, the harvest of the Nile, brought you profits. She was marketplace for the nations. 4 Shame, Tzidon, for the sea speaks; the fortress of the sea says, “I no longer have labor pains or bear children, yet I have raised neither boys nor girls.”
Verse 12 NCV:
He said, “Sidon, you will not rejoice any longer, because you are destroyed. Even if you cross the sea to Cyprus [Kittim], you will not find a place to rest.”
Zechariah 9:1-3
Revised Standard Version
‘The word of the Lord is against the land of Hadrach and will rest upon Damascus [capital of Aram]. For to the Lord belong the cities of Aram [son of Shem], even as all the tribes of Israel; Hamath [city of Canaan] also, which borders thereon, Tyre and Sidon, though they are very wise. Tyre has built herself a rampart, and heaped up silver like dust, and gold like the mud of the streets.’
Tyre is associated with the intermediate ‘Canaanites’ or Phoenicians; whereas the later ‘Phoenicians’ are linked with Sidon. Though the Phoenicians are White peoples descended from Shem, both nations today also contain a Black population descended from Canaan. We will study scriptures regarding Sidon, when we look at the European peoples who dwell within this nation – Chapter XXXII Issachar, Zebulun, Asher & Naphtali – the Antipodean Tribes.
Modern day Sidon is en route from Tarshish-Japan and Kittim-Indonesia and links them to present day Tyre-Brazil – Chapter XXIII Aram & Tyre: Spain, Portugal & Brazil.
All are major trading nations and key ports. As Sidon is associated with Hamath and other Canaanites, we are looking for a prominent nation on the coast of Africa.
Sidon is the Republic of South Africa* – with indicators pointing to its Black citizens stemming from the Canaanite clan of Hiv (refer Chapter XXVII Abraham & Keturah – Benelux & Scandinavia).
Sin and Zemar are not mentioned outside of Genesis and 1 Chronicles. Ark is mentioned in Joshua 16:1-3, NET within the original lands of the tribe of Jospeh:
‘The land allotted to Joseph’s descendants extended from the Jordan at Jericho to the waters of Jericho to the east, through the desert and on up from Jericho into the hill country of Bethel. The southern border extended from Bethel to Luz, and crossed to Arkite territory at Ataroth. It then descended westward to Japhletite territory, as far as the territory of lower Beth Horon and Gezer, and ended at the sea.’
Arvad equates with the people of Angola – and perhaps populated by peoples descending from the Canaanite clan of Amor (refer Chapter XXII Alpha & Omega).
Arvad is connected in a military capacity with Sidon and particularly Tyre.

Flag of Angola
Ezekiel 27:8, 11
New English Translation:
‘The leaders of Sidon and Arvad were your rowers; your skilled men, O Tyre, were your captains… The Arvadites joined your army on your walls all around, and the Gammadites were in your towers. They hung their quivers on your walls all around; they perfected your beauty.’

Angolan man and woman

The link between Angola and Tyre will be become clear when we study Tyre, for Angolans were taken and used as slaves while a former colony – refer Chapter XXIII Aram & Tyre: Spain, Portugal & Brazil.
Excluding Arab nations, Angola is the eighth most populous African nation – with 39,666,794 people – and possesses the fourth strongest military in sub-Saharan Africa, behind Nigeria, South Africa and Ethiopia at third. Angola is Africa’s second largest oil producer. Though by the year 2100, Angola is projected to be the 13th most populous nation in the world with 150,046,000 people.
The meaning of Arvad is a ‘wandering fugitive’ from the verb ‘arad, ‘to flee’ or ‘be free’ and the verb rud, ‘to wander restlessly.’

Luanda – capital of Angola
Hamath is mentioned a number of times and linked with Arvad, who in turn is associated with Sidon.
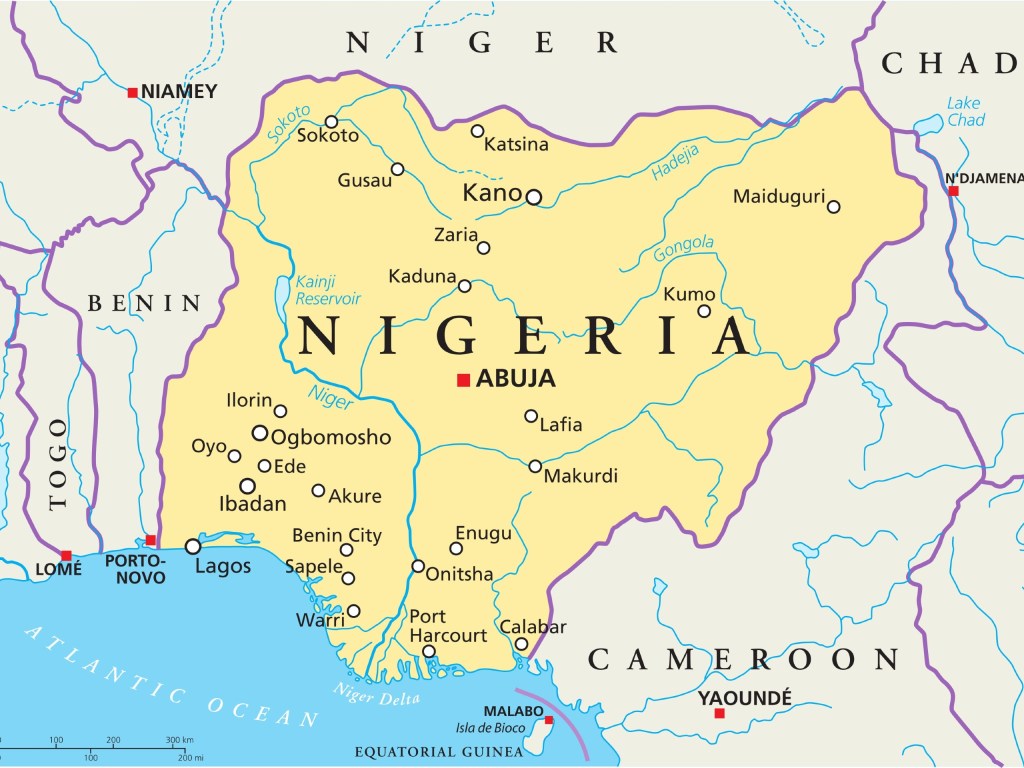
Hamath is the most prominent Canaanite region (city-state) after Sidon and today is the nation of Nigeria – with its people likely coming from the Canaanite clan of Heth.
A noteworthy ‘coincidence’ is Ham-ath being similar to the name of Canaan’s stepfather, Ham.
Just as Niger-ia has been originally named from the Latin niger for black.
Not so coincidentally, is the Nigerian tribes of Ham and Hyam.

Nigerian man and woman
2 Kings 19:13
English Standard Version
‘Where is the king of Hamath, the king of Arpad [Arvad], the king of the city of Sepharvaim, the king of Hena, or the king of Ivvah?’ – Isaiah 36:19.
2 Samuel 8:9-10
English Standard Version
When Toi king of Hamath heard that David had defeated the whole army of Hadadezer [of Zobah], Toi sent his son Joram to King David…’ – 1 Chronicles 18:1-5, Ezekiel 47:17.
The link between Hamath and King David of Judah is significant and not a coincidence – refer Chapter XXX Judah & Benjamin – the Regal Tribes.

These verses also highlight the strength of Hamath – a sizeable nation commensurate with the economic or military clout of Sidon is being discussed.
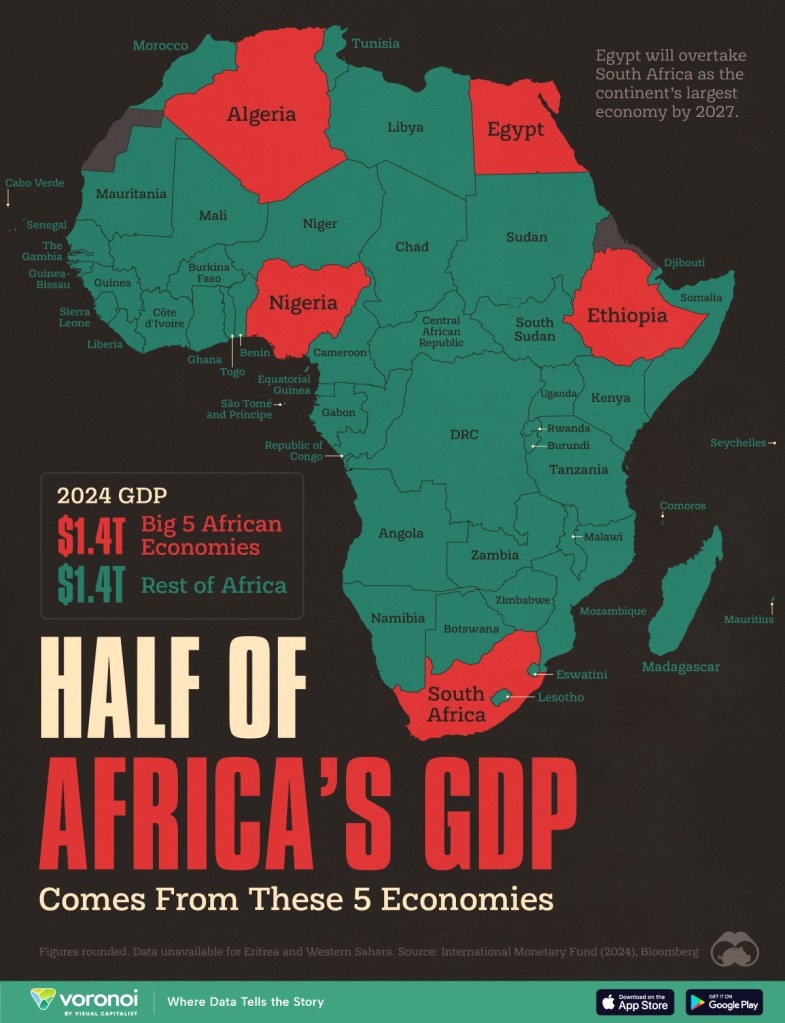
Nigeria with South Africa is a leading nation in Africa. It has an immense population of 240,147,796 people – sixth highest in the world.
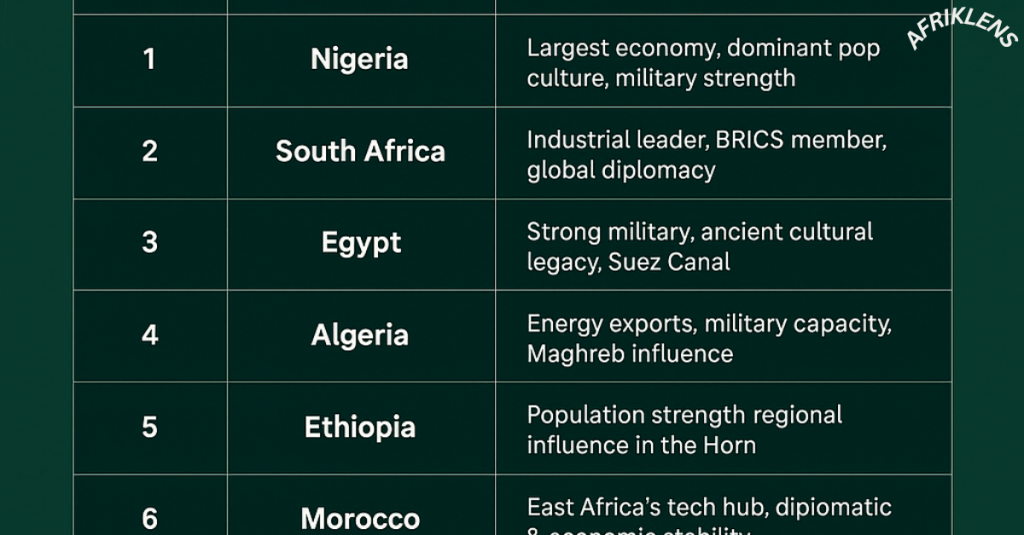
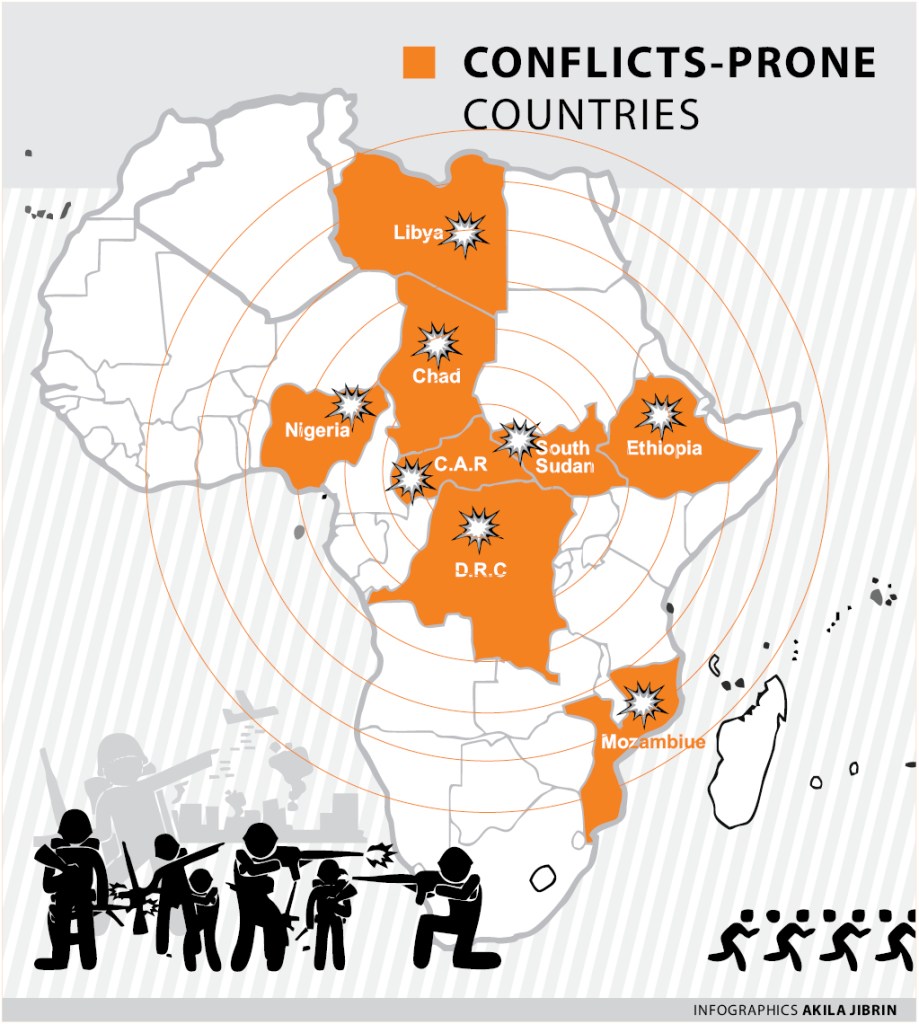
The most powerful nations overall (above) – economically and militarily – on the African continent
Notice on the fertility rate chart earlier how Nigeria has one of the highest rates in the world. Nigeria is in red, located south of Niger in Pink, with the highest rate in the world.
Nigeria’s projected population by 2050 is 350 million people and by 2100, it is a staggering 477 million people. This would make Nigeria the fourth most populous nation in the world behind India (1), China (2) and Pakistan (3) and ahead of the DR Congo (5) and the United States of America (6).
An online encyclopaedia, provides a summary of Nigeria’s recent history – emphasis mine:
‘… The Kano [Cana-an] Chronicle highlights an ancient history dating to around 999 AD of the Hausa Sahelian city-state of Kano, [Hamath city-state of Canaan] with other major Hausa cities… all having recorded histories dating back to the 10th century.’
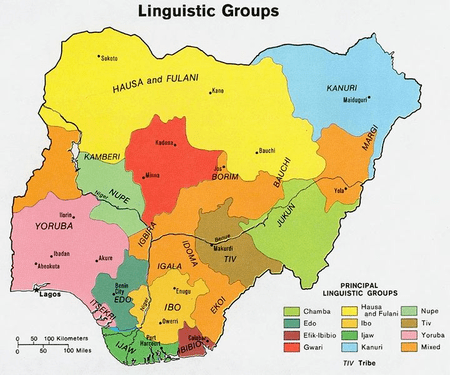
The following Nigerian tribes also have names with more than a passing similarity with Canaan:
Kana-kuru, Kane-mbu, Kani-kon, Kanu-fi, Kanu-ri and Kene-rn.
Recall the Hebrew verb: Kana
Encyclopaedia:
‘With the spread of Islam from the 7th century AD, the area became known… as Bilad Al Sudan (English: Land of the Blacks…) There are early historical references by medieval Arab and Muslim historians and geographers which refer to the Kanem-Bornu Empire [Kai-nam, Ken-an] as the region’s major centre for Islamic civilization.
In the 16th century, Portuguese explorers [modern day descendants of the Phoenicians from Tyre] were the first Europeans to begin significant, direct trade with peoples of Southern Nigeria, at the port they named Lagos and in Calabar along the [regions of the] Slave Coast.’

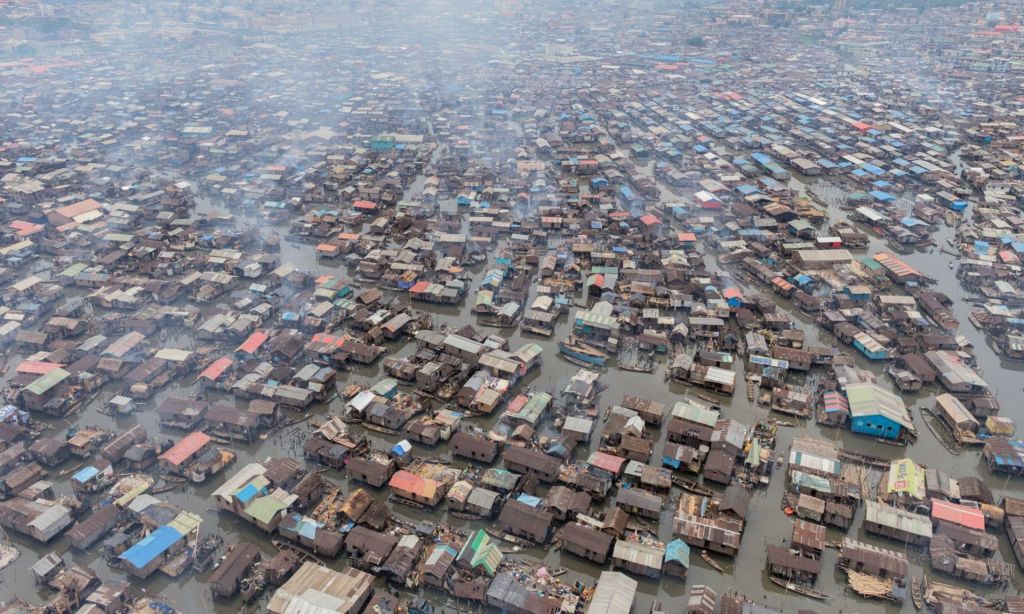
City of Lagos, the former capital until 1991 when it was replaced by Abuja – the prosperity of Lagos above in contrast with the poverty of the floating slum below.
Encyclopaedia:
‘Europeans traded goods with peoples at the coast; coastal trade with Europeans also marked the beginnings of the Atlantic slave trade. The port of Calabar on the historical Bight of Biafra (now commonly referred to as the Bight of Bonny) became one of the largest slave trading posts in West Africa in the era of the transatlantic slave trade.
The majority of those enslaved and taken to these ports were captured in raids and wars. Usually the captives were taken back to the conquerors’ territory as forced labour; [in] time, they were sometimes acculturated and absorbed into the conquerors’ society. A number of slave routes were established throughout Nigeria linking the hinterland areas with the major coastal ports.’
We will return to the significance of the Portuguese being the first European peoples in the modern era, to both trade and colonise areas outside of Europe – refer Chapter XXIII Aram & Tyre: Spain, Portugal & Brazil.
Encyclopaedia:
‘In the north, the incessant fighting amongst the Hausa city-states and the decline of the Bornu Empire gave rise to the Fulani people gaining headway into the region. At the beginning of the 19th century, Usman dan Fodio led a successful jihad against the Hausa Kingdoms founding the centralised Sokoto Caliphate (also known as the Fulani Empire).
The empire with Arabic as its official language grew rapidly under his rule and that of his descendants, who sent out invading armies in every direction. The vast landlocked empire connected the East with the West Sudan region and made inroads down south conquering… and [advancing]… with the goal of reaching the Atlantic Ocean. The territory controlled by the Empire included much of modern-day northern and central Nigeria.
The Sultan sent out emirs to establish a suzerainty over the conquered territories and promote Islamic [civilisation], the Emirs in turn became increasingly rich and powerful through trade and slavery.
By the 1890s, the largest slave population in the world, about two million, was concentrated in the territories of the Sokoto Caliphate. The use of slave labor was extensive, especially in agriculture. By the time of its break-up in 1903 into various European colonies, the Sokoto Caliphate was one of the largest pre-colonial African states.
A changing legal imperative ([the] transatlantic slave trade [was] outlawed by Britain in 1807)… [caused]… illegal smugglers [to purchase] slaves along the coast by native slavers. Britain’s West Africa Squadron sought to intercept the smugglers at sea. The rescued slaves were taken to Freetown, a colony in West Africa originally established for the resettlement of freed slaves from Britain.
In 1885, British claims to a West African sphere of influence received recognition from other European nations at the Berlin Conference. The following year, it chartered the Royal Niger Company… By the late 19th and early 20th centuries, the company had vastly succeeded in subjugating the independent southern kingdoms along the Niger River.
[The] British conquered Benin in 1897, and, in the Anglo-Aro War (1901–1902), defeated other opponents. The defeat of these states opened up the Niger area to British rule. In 1900, the company’s territory came under the direct control of the British government and established the Southern Nigeria Protectorate as a British protectorate and part of the British Empire, the foremost world power at the time. On 1 January 1914, the British formally united the Southern… and the Northern… [Protectorates] into the Colony and Protectorate of Nigeria.
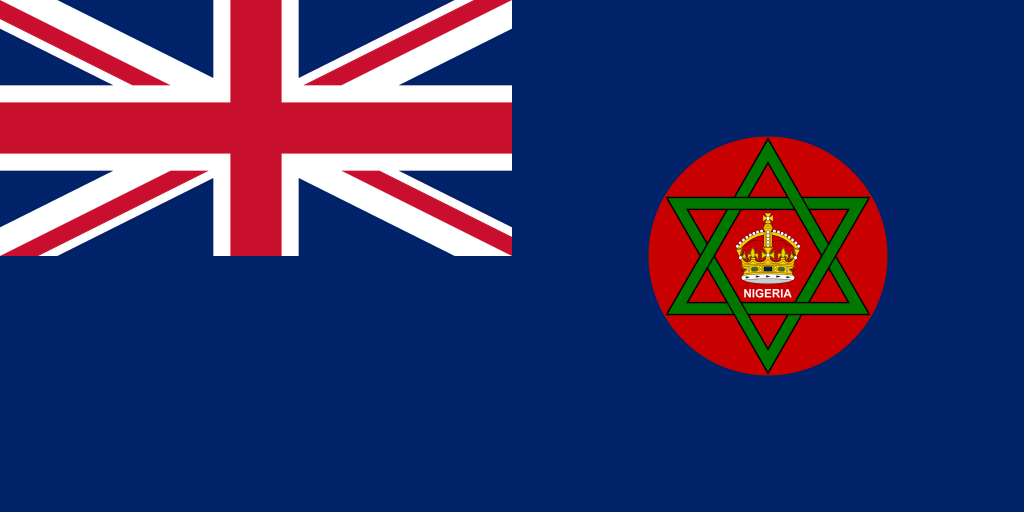
Nigerian colonial Flag from 1914 to 1952
Inhabitants of the southern region sustained more interaction, economic and cultural, with the British and other Europeans owing to the coastal economy. By independence in 1960, regional differences… were marked. The legacy, though less pronounced, continues to the present [day, with imbalances] between North and South. For instance, northern Nigeria did not outlaw slavery until 1936 whilst in other parts of Nigeria slavery was abolished soon after colonialism.
Nigeria is classified as a mixed economy emerging market. It has reached lower-middle-income status according to the World Bank with its abundant supply of natural resources, well-developed financial, legal, communications, transport sectors and stock exchange (the Nigerian Stock Exchange), which is the second-largest in Africa. Nigeria is the United States’ largest trading partner in sub-Saharan Africa and supplies a fifth of its oil (11% of oil imports). The United States is the country’s largest foreign investor.
Economic development has been hindered by years of military rule, corruption, and mismanagement. The restoration of democracy and subsequent economic reforms have successfully put Nigeria back on track towards achieving its full economic potential.
Next to petrodollars, the second-biggest source of foreign exchange earnings for Nigeria are remittances sent home by Nigerians living abroad. Nigeria made history in April 2006 by becoming the first African country to completely pay off its debt (estimated $30 billion) owed to the Paris Club. Nigeria is trying to reach the Sustainable Development Goal Number 1, which is to end poverty in all its forms by 2030.’

Nigeria is the 52nd largest economy in the world and the second biggest in the sub-Saharan African continent after South Africa. Its 2025 nominal GDP was $285 billion dollars.
Nigeria’s economy relies heavily on the oil industry and is the largest oil exporter on the continent; with Africa’s largest reserves of natural gas. Resource extraction industries, such as coal, tin, and other metal mining are integral to the Nigerian economy. Oil dominates in terms of contribution to GDP and exports. Between a fifth and a half of Nigerians work in agriculture, primarily small-scale subsistence agriculture. Nigeria’s economy has grown rapidly in the past few decades, but it also faces significant challenges such as desertification and lack of infrastructure.
‘The following export product groups represent the highest dollar value in Nigerian global shipments during 2021.
- Mineral fuels including oil: US$42.4 billion
- Ships, boats: $1.4 billion
- Fertilizers: $949.8 million
- Cocoa: $628.8 million
- Oil seeds: $326.2 million
- Zinc: $258.8 million
- Aluminum: $190.3 million
- Aircraft, spacecraft: $143.7 million
- Tobacco, manufactured substitutes: $112.8 million
- Lead: $94.1 million
Fertilizers represent the fastest grower among the top 10 export categories, up by 423.8% from 2020 to 2021. In second place for Nigeria’s improving export sales was aluminum via a 341.2% gain. Shipments of lead: posted the third-fastest gain in value, up by 256.5%. The leading decliner among Nigeria’s top 10 export categories was ships and boats, thanks to a -30.3% drop year over year.’

The Flag of Nigeria with Coat of Arms
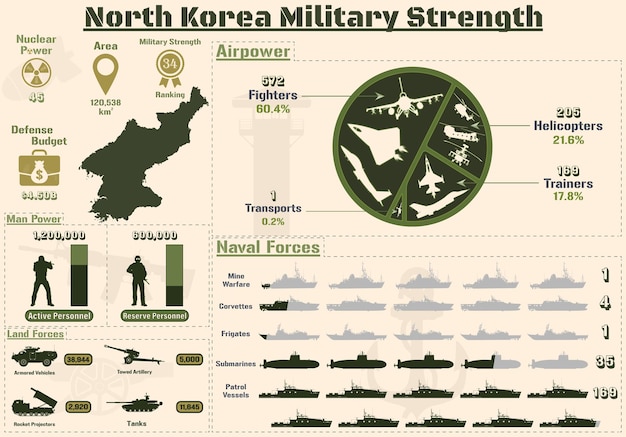
‘Militarily, Nigeria is ranked 33rd globally and third in Africa [behind Egypt and Algeria] in the 2026 Global Firepower Index, reflecting its significant military capabilities and regional influence.’
Nigeria has two main religions, though it is Islam which predominates with 56% of the population identifying as Muslim and 43% as Christian.
Going forward, this means Nigeria could be perceived as a Muslim nation and so with that in mind, it is possible Nigeria is part of the Islamic alliance which comprises the future King of the South in biblical prophecy – Article: Four Kings & One Queen.
While leadership of the alliance could perhaps be held by either Turkey, Iran, Pakistan or Egypt, there would undoubtedly be other member countries such as the major muslim nation, Bangladesh. This then could entail a confederacy stretching from as far as Indonesia in the East to Nigeria in the West.
Heth in Hebrew means: ‘terror, dread,’ From the verb hatat, ‘to deplete of courage.’
A formidable name and the latter White peoples known by that name, certainly lived up to it. The Hittites in the Bible, are in every case, in reference to the later peoples – Chapter XXVIII The True Identity & Origin of Germans & Austrians – Ishmael & Hagar.
One passage which refers to the original people of Heth is in Genesis chapter twenty-three.
Genesis 23:8-11
English Standard Version
8 ‘And he said to them, “If you are willing that I [Abraham] should bury my dead out of my sight, hear me and entreat for me Ephron the son of Zohar, 9 that he may give me the cave of Machpelah, which he owns; it is at the end of his field. For the full price let him give it to me in your presence as property for a burying place.” 10 Now Ephron was sitting among the Hittites, and Ephron the Hittite answered Abraham in the hearing of the Hittites, of all who went in at the gate of his city, 11 “No, my lord, hear me: I give you the field, and I give you the cave that is in it. In the sight of the sons of my people I give it to you. Bury your dead.”
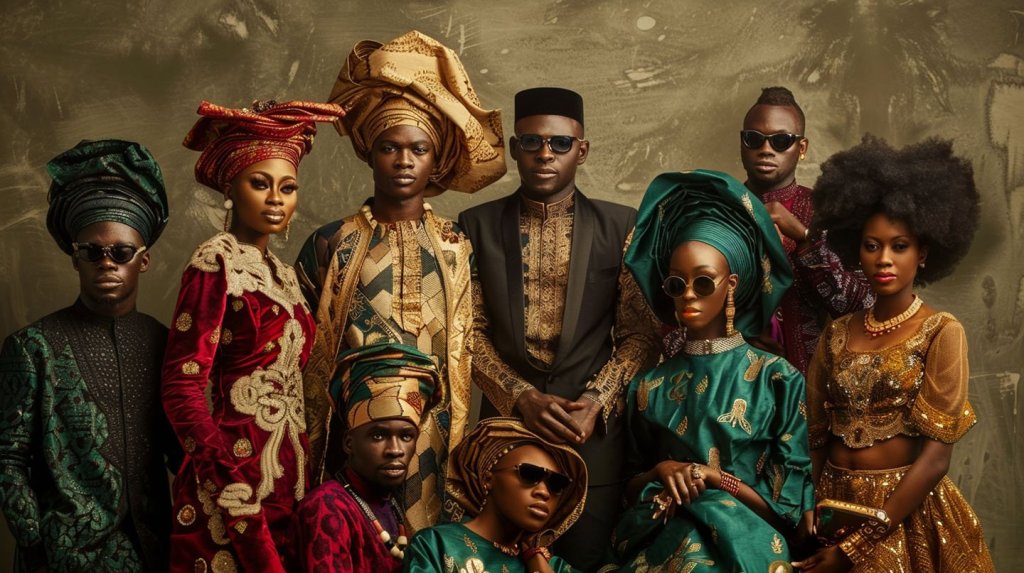
Nigerian Culture, Tradition, Diversity and Heritage
Jebus in Hebrew means: ‘trodden underfoot, he will trample down.’
The numerous references to the Jebusites including all the Canaanite clans are in the main, about the Nephilim descended Elioud giants or people dwelling in Canaan who intermarried with them. We will look at a selection of verses for these peoples in a subsequent chapter.
Amor in Hebrew means: ‘talkers.’
Genesis 15:18-21
English Standard Version
18 On that day the Lord made a covenant with Abram, saying, “To your offspring I give this land, from the river of Egypt to the great river, the river Euphrates, 19 the land of the… 20 the Hittites, the Perizzites… 21 the Amorites, the Canaanites, the Girgashites and the Jebusites.”
Girgash in Hebrew means: ‘dwellers in a clayey soil,’ ‘take and stroke’,
Hiv: ‘villagers’ and
Perizz: ‘wildling, rural.’
The Canaanites and Perizzites are almost always placed together. Their relationship is not clear.
Genesis 13:7
English Standard Version
‘… and there was strife between the herdsmen of Abram’s livestock and the herdsmen of Lot’s livestock. At that time the Canaanites and the Perizzites were dwelling in the land.’
Online encyclopaedia – emphasis mine:
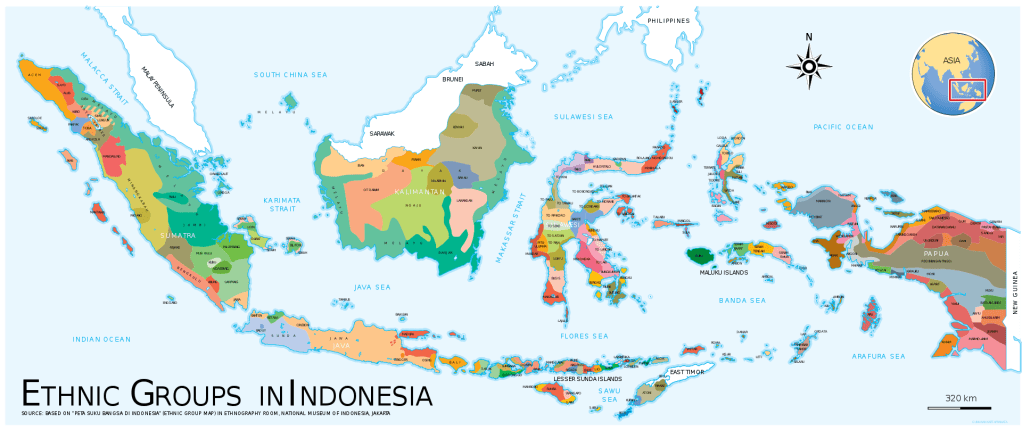
‘A 2009 genetic clustering study, which genotyped 1327 polymorphic markers in various African populations, identified six ancestral clusters. The clustering corresponded closely with ethnicity, culture and language. A 2018 whole genome sequencing study of the world’s populations observed similar clusters among the populations in Africa.’
Whether it was twelve, eleven or six principle Canaanite lines of descent, it appeared difficult to ascertain.
Scientific identification of six ancestral clusters, supports Aaron Demsky’s hypothesis and so we now have convincing support – as per the scriptural account – for Canaan’s six clans (and cities):
1 Hiv (Sidon)
2 Heth (Hamath)
3 Amor (Arvad)
4 Jebus, 5 Girgash and 6 Canaan (Sin, Ark and Zemar)
The major African ethnic groups could be divided (and paired) as located in:
1 Southern Africa
2 Western Africa
3 Central Africa
4 Eastern Africa, 5 Horn of Africa and 6 North Africa (Berbers)
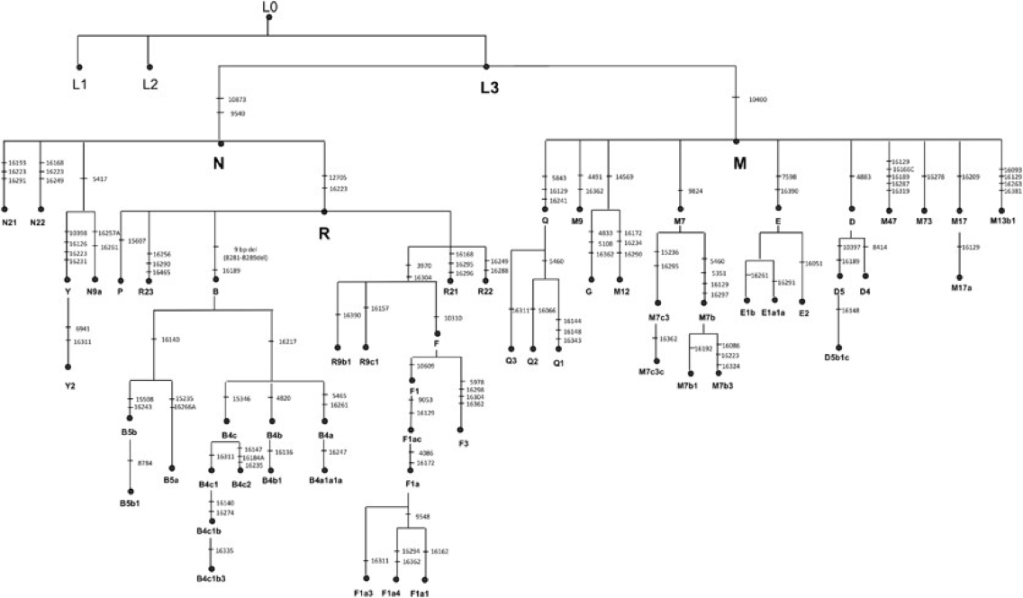
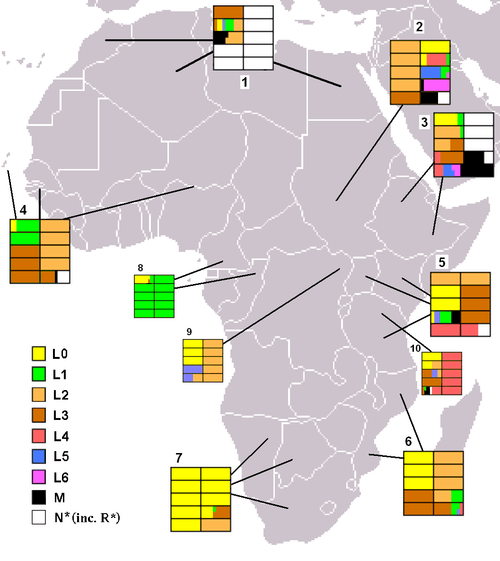
The fact there are six prime mtDNA mutations (founding lineages) of Haplogroup L from Na’eltama’uk, comprising the L0 to L5 Haplogroups – all stemming from Haplogroup L carried by mitochondrial Eve and perhaps Emzara, the wife of Noah – exhibited in the peoples primarily in sub-Saharan Africa, is assuredly beyond a coincidence – refer Chapter XI Ham Aequator.

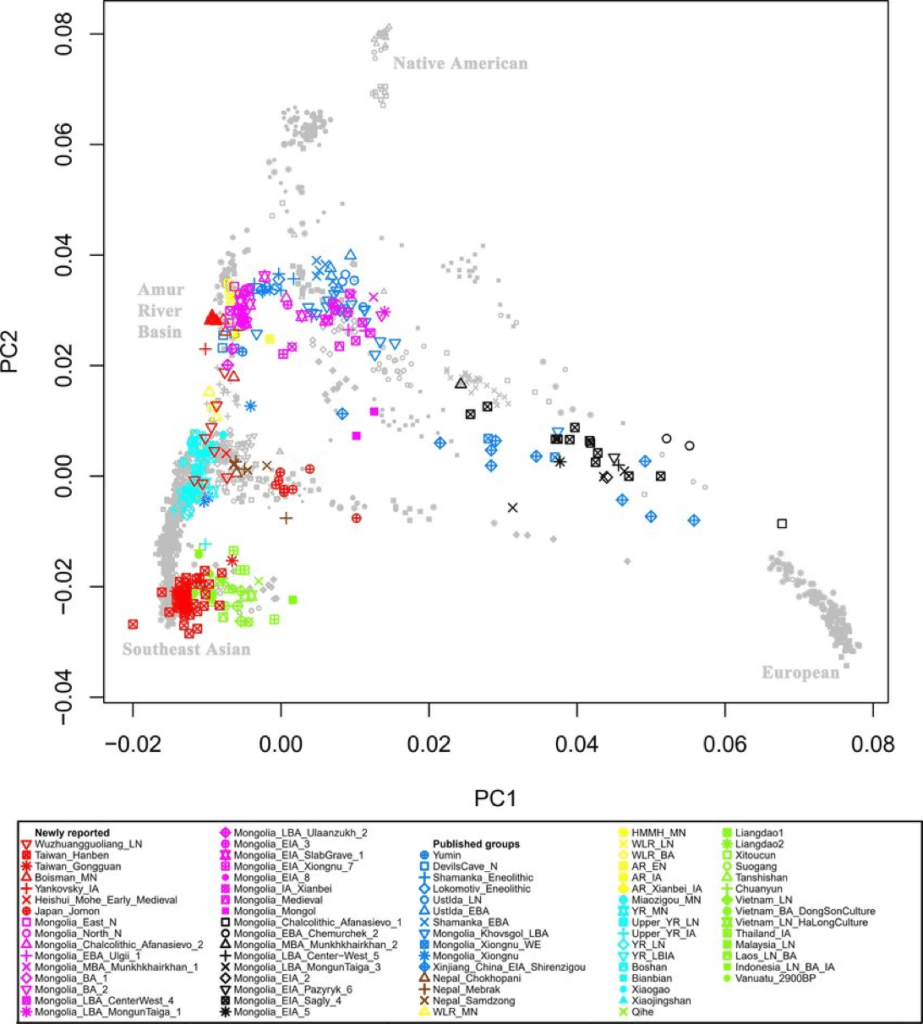
In Chapter X Magog, Tubal & Meshech, the article Y Chromosomes of 40% Chinese Descend from Three Neolithic Super-Grandfathers stated in its additional paper – emphasis & bold mine:
‘… clade E [is distributed] mainly in Africa, so there are two hypotheses, 1) haplogroups D and CF migrated out of Africa separately; 2) the single common ancestor of CF and DE migrated out of Africa followed by a back-migration of E to Africa. From this study, the short interval between CF/DE and C/F divergences weakens the possibility of multiple independent migrations (CF, D, and DE*) out of Africa, and thus supports the latter hypothesis…
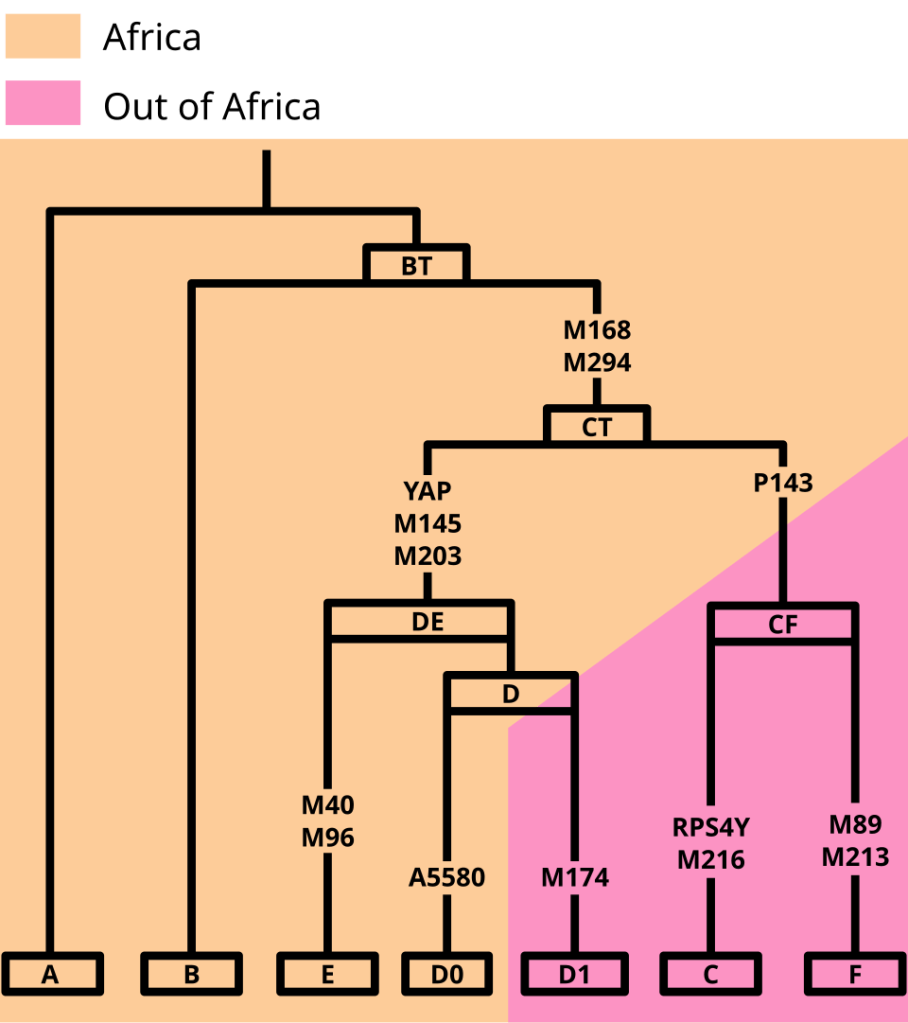
Y DNA haplogroup A represents the oldest branch of the Y-chromosome phylogeny. Like haplogroup B, it only appears in Africa, with the highest frequency among the hunter-gatherer groups in Ethiopia and Sudan. A3b1 is a Khoisan exclusive haplogroup [in Southern Africa].’
The alternative view of mankind ‘beginning’ in the Middle East (following a migration from the Indus Vally – refer Chapter I Noah Antecessor Nulla) is more viable and this would support what we have learned with the descendants of Canaan migrating to Africa, not from Africa and culminating in a supposed ‘back-migration.’
Scientists concur that Y-DNA Haplogroup A is the oldest and original Haplogroup (derived from Y-DNA Adam) and associated with Black people and then make the incorrect assumption, that all people have come out of Africa. The exact same presumption has been made with mtDNA Haplogroups L0 and L1.
This fabrication supports the unproven evolutionary theory for mankind, but does not allow for a provable pre-flood world, with a singular Brown/Black line – or dual racial lines if we include the Neanderthal of Day Six, a Yellow/Red line – and the introduction or rather activation of the genes for a White line through Noah and his son Shem after the great Flood – refer Chapter XVI Shem Occidentalis; Articles: Homo neanderthalensis I, II, III & IV; Designated Design or Chance Chaos? and Y-DNA Adam & mtDNA Eve: The Genesis & Evolution of Homo sapiens.
After the deluge, the new races would evolve from the twenty-one lines from Noah’s grandsons, repopulating the world from the Hindu Kush and Indus Valley regions, as opposed to the African continent – refer Chapter I Noah Antecessor Nulla.

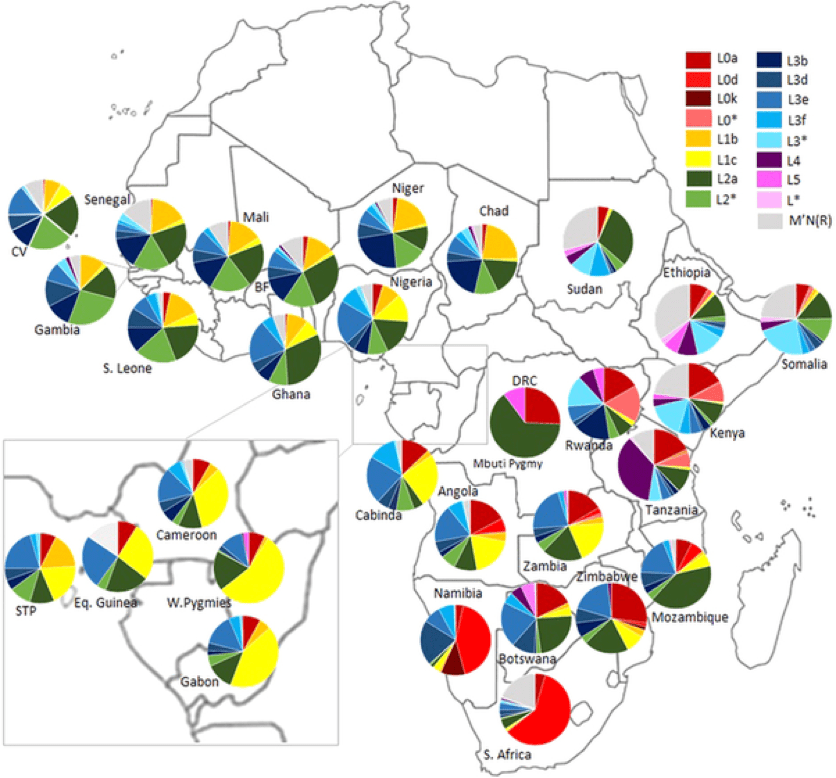
African Human mtDNA phylogeography at a glance, Alexandra Rosa & António Brehm, 2011 – emphasis & bold mine:
L0
‘Macrohaplogroup L divides into haplogroups L0-L6… Haplogroup L0 further includes sub-haplogroups L0a, L0d, L0f and L0k… L0d, the first individual sub-clade to derive from the L0 node…its divergence from L0abfk… The distribution of this clade appears to be restricted to Khoisan people in South Africa, and to Tanzanian and Angolan populations… Similarly, sub-haplogroup L0k is found almost exclusively among South African Khoisan… existing also at low frequencies among click-speaking Tanzanian groups…
Their L0d and L0k shared lineages, which represent more than half of their maternal pool suggest an ancestral link predating the appearance of present-day click-speakers, likely remnants of an East African proto-Khoisan population… The mtDNA pool of the Khoisan people shows over 60% of L0d and L0k lineages… The L0a1 sub-clade has an eastern and southeastern African distribution including Nubia, Sudan and Ethiopia… L0a2 lineages are thought to trace the dispersal of Bantu-speakers towards South Africa…’
L1
‘MtDNA L1… One of its daughter clades, haplogroup L1b, is concentrated in western-central Africa, particularly along the coastal areas… peaking in the Senegal Mandenka and Wolof… and Fulani people in Burkina-Faso, Chad and South Cameroon… L1c occurs frequently in Central and West Africans… Curiously, more recent reports state frequencies ranging 18-25% in Angola Bantu ethnic groups…
A substantial revision for the L1c phylogeny has been proposed by Quintana-Murci et al. (2008). It shed additional light… and helped corroborate past relationships between Central African Bantu-speaking farmers and their hunter-gathering neighbors, the Pygmies… Both groups likely shared an ancestral Central-African proto-population rich in L1c mtDNAs… and evolved into the diverse forms observed today among the modern agricultural populations (L1c1a, L1c1b, L1c1c, L1c2-6, etc.) while L1c1a is the only surviving clade in western Pygmies… Both L1b and L1c were proposed as Central Africa autochthonous [indigenous] lineages…’
L2
‘Together with L3, haplogroup L2 comprises~70% of the sub-Saharan maternal variation. Haplogroup L2a is the most frequent and wide-spread mtDNA cluster in Africa, reaching over 40% in Tuareg from Niger/Nigeria and Mali… Recent star-like demographic bursts in L2a1a and L2a2 and their expansion to southeast people are most likely associated with the expansion(s) of the Bantu-speaking populations… L2b-L2d haplogroups are dominant and largely confined to West and West-Central Africa…’
L3
‘… superhaplogroup L3… is widespread in Africa, its frequency and diversity providing evidence of a sub-Saharan expansion of its sub-clades towards West Africa…
This superhaplogroup is subdivided into various clades and harbours also the two main M and L superhaplogroups found outside of Africa.
Both L3b and L3d are prevalent in the West quadrant of sub-Saharan Africa… in average 10%… L3b also shows considerable frequencies in the Hutu people in Rwanda… and South African Kung… L3d constitutes an important percentage of the South African maternal pool, being more expressive in Angola and Tanzania… a subset of L3b is common among Bantu speakers of south-western Africa and thus is a likely marker of the Bantu expansion…
The L3e cluster has been subdivided into L3e1, L3e2, L3e3 and L3e4, since the time of HVS-I information per se… The oldest branches of L3e are thought to have arisen in Central Africa/nowadays Sudan… Within L3e2, the L3e2b lineages constitute the most frequent and widespread type of L3e, primarily found in West and Central Africa…
The network in Cerný et al. (2007) reflects a clear starlike phylogeny of L3e5 types found mostly in western Central Africa. Although an important diffusion has occurred into North Africa, the root type is relatively prevalent in the Chad Basin… The diffusion of haplogroup L3f ranges from Ethiopia in the east, to Angola and Mozambique in the south, the Chad Basin in Central Africa, Guinea-Bissau in the west and Tunisia in the north…
L3f1 founder lineages in Central and West Africa… L3f2 is a quite infrequent clade found almost exclusively among Chad speaking populations from the Chad Basin and virtually absent from Niger-Congo and Nilo-Saharan peoples… Therefore, it is contemporary with its sister clade L3f1, and probably arose around the Chad Basin area. Nevertheless, the haplogroup is present in northern Cushitic groups from Somalia and Ethiopia…’
L4
‘Haplogroup L4 is a sister clade of L3, typical of East and Northeast Africa, although present at low frequencies… The L4a motif has been found in Sudan and Ethiopia, though initially misclassified as L3e4… Similarly we also refer to L4b2, previously known as L3g… or L4g… This is frequent in Tanzania and Amhara and Gurages from Ethiopia…’
L5
‘Haplogroup L5, previously known as L1e, occupies an intermediate position between L1 and L2’3’4’6… It has been observed at low frequencies in eastern Africa, namely Egypt, Sudan, Ethiopia, Kenya, Rwanda and Tanzania, with minor gene flow introducing these lineages in the Mbuti Pygmies and North Cameroon Fali… The Central African Pygmies particular genetic pool including both L1c and L5 may assign them a “relict” status, similar to that proposed for the Khoisan…’
L6
‘The variation classified as haplogroup L6… is nowadays largely confined to Yemeni people and a few samples in Ethiopian Amhara and Gurages. It is noteworthy that L6 presents a very narrow phylogeography… Given its presence in Ethiopians, where its sister clades are also diverse and frequent… L6 has a most likely origin in East Africa, where it might have been preserved in isolation for tens of thousands of years. In any case the homeland of L6 may still be missing.’
African Americans
‘The current distribution range of African mtDNA lineages is far broader than the African continent. Long-distance gene flow mediated by the Atlantic slave trade since the 16th century is worth mentioning in this review.
Brazilians harbor the most important reservoir of African maternal lineages outside of Africa.
Early description of the genetic landscape of Brazilians with sub-Saharan ancestry confirms the historical evidence, with L1c and L3e lineages summing up to nearly half of the African share…
Later studies on Afro-Americans residing in the American continent report 65% of mtDNA types in South America as having a Central African origin, 41% and 59% of Central Americans tracing progeny to West Central Africa and West Africa respectively, while North American ancestors are estimated as being 28% West-Central Africans and 72% West Africans…
These results corroborate the historical record of these regions… The origin of Afro-Americans in U.S.A. is associated with West African (>55%) and West-Central/Southwest African (<45%) mothers, also in close proximity to historical data…
Recent results on admixture analysis suggest that Africans brought to Brazil as slaves were originally from two geographical regions: i) 69% of the maternal pool of Black Brazilians in Rio de Janeiro is attributed to West-Central and Southeast Africa, close to two former Portuguese colonies (Angola and Mozambique)’ – refer Chapter XXIII Aram & Tyre: Spain, Portugal & Brazil – ‘and ii) 82% of mtDNA lineages in Porto Alegre are found in West Africa, in the northern portion of the Gulf of Guinea…
Such detailed analysis is possible given the clear mtDNA haplogroup structure which allows the discrimination of geographic/linguistic origins. Once again genetic records are in agreement with historical data…’
African-American mitochondrial DNAs often match mtDNAs found in multiple African ethnic groups, multiple authors, 2006 – emphasis & bold mine:
‘The Atlantic slave trade resulted in the forced migration of an estimated 11 million Africans to the Americas.
Only 9 million are thought to have survived the passage, and many more died in the early years of captivity. Historical accounts indicate that virtually all enslaved Africans brought to North America came from either West or West Central Africa. A recent comparison of mtDNA sequences from 1148 African Americans living in the US with a database of African mtDNA sequences showed that more than 55% of the US lineages have a West African ancestor, while fewer than 41% came from West Central or South West Africa.
Because mitochondrial DNA (mtDNA) is passed from mother to daughter with few, if any, changes occurring over many generations, it is possible to compare contemporary African-American mtDNA haplotypes with contemporary mtDNA haplotypes in a worldwide database to obtain information about the ancestral origins of these mtDNAs.’

‘In such a comparison, continent-specific haplotypes are readily observed, and the assignment of mtDNAs to continent of origin is relatively straightforward. The more difficult task is to tie particular mtDNA haplotypes to specific geographical regions and ethnic groups within a continent.
This task is particularly difficult for Africa, as there is more genetic diversity among Africans than among people from any other continent…
The most extensive pan-African haplotype… is in the L2a1 haplogroup. 40% of African-American mtDNAs did not match any sequence in the database, it is clear that matches to a single African ethnic group will not be the outcome for most African Americans, and even when a match to a single ethnic group is obtained, multiple matches may occur in a larger database.
Furthermore, for the typical African American, the maternal ancestor who was the source of the mtDNA was just one of hundreds of enslaved African ancestors.
In fact, it [is] likely that there has been more mixing of African ethnic groups in the Americas than has ever occurred elsewhere.
Thus, the ancestors of virtually all contemporary African Americans came from a large number of ethnic groups located throughout the region from Senegal to Angola.’

Whole-mtDNA Genome Sequence Analysis of Ancient African Lineages, multiple authors, 2007:
‘Several L haplogroup lineages occur most frequently in eastern Africa (e.g., L0a, L0f, L5, and L3g), but some are specific to certain ethnic groups, such as haplogroup lineages L0d and L0k that previously have been found nearly exclusively among southern African “click” speakers.
The presence of very old mtDNA haplogroups (i.e., L0d, L0f, and L5) in Tanzanians that are rare or absent in other regions of Africa suggests populations in Tanzania may have had a large long-term effective population size and/or a large degree of long-term population structure, which has acted to preserve many divergent and rare mtDNA haplogroup lineages that appeared early in modern human history. The presence of these ancient lineages in Tanzania also suggests that eastern Africa might be the source of origin of many other African mtDNA haplogroup lineages. Our findings are consistent with other studies of mtDNA genetic diversity in African populations that have suggested populations in eastern Africa form a highly diverse gene pool…’

We have learned that certain African populations – for instance in Tanzania and Angola – are older, in that they possess clades of mtDNA Haplogroup L0. It is the oldest Haplogroup on the mtDNA tree originating from mitochondrial Eve and has been passed from mothers to sons and daughters ever since. Haplogroup L0 is indicative of the peoples of Southern Africa and the Khoisan are a representative example. They possess a light brown skin. Thus the biblical Eve would have been in all probability… light brown – as would Noah’s wife, Emzara.
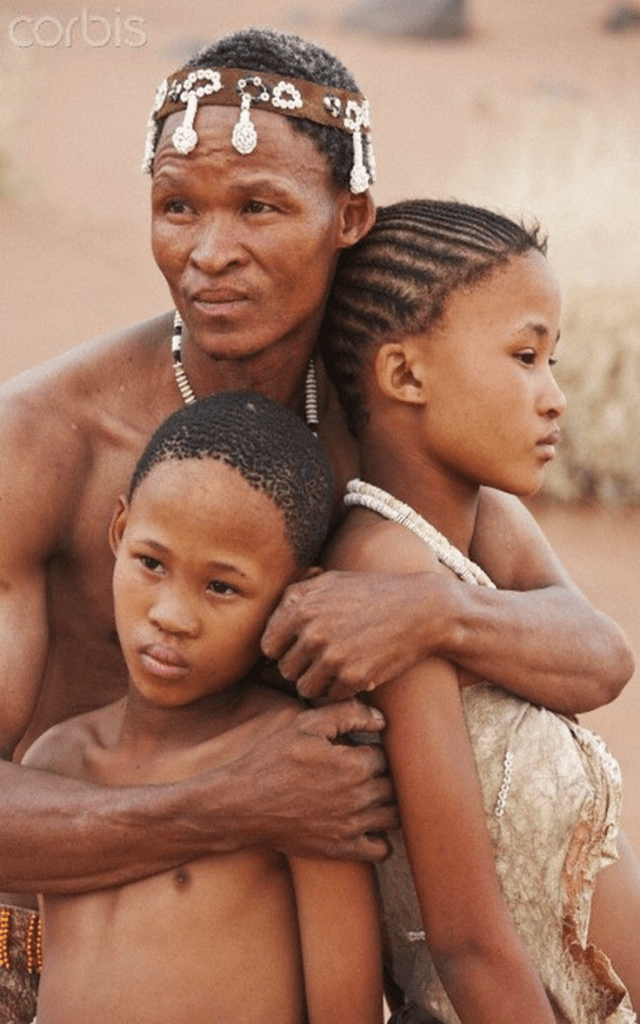
Khoisan of South Africa
The most ancient Y-DNA Haplogroup – the Y sex chromosome passed from fathers only to their sons – originating from Y-DNA Adam, is Haplogroup A.

It is only indicative of a proportion of sub-Saharan Africans, with the oldest clade of A00 – known as ‘Perry’s Y’ – discovered in an African American in 2012.
Haplogroup A00 was first discovered in Mbo Bantu men from West Cameroon. Bantu can vary in skin tone from light brown to medium brown. The highest concentration of Haplogroup A00 found in 2015, belonged to the Bangwa (Grassfields Bantu) of the Mbo.
The Bantu woman below, is a similar skin tone to the Khoisan. Again, the probability that the biblical Adam was also light brown… is highly likely. Every human descends from mutated DNA genetic code, which originally began with ancestors in the distant past who are today, most closely aligned with the Bantu and Khoisan peoples.

A sample of Y-DNA Haplogroups, representing males from the six largest African nations in population; with the addition of Ghana, Namibia, Senegal and Rwanda.
Kenya and Tanzania are represented by Bantu; South Africa is represented by the southern Bantu, Zulu; and the Khoisan. Namibia’s Haplogroups derive from the Nama; and Rwanda’s from the Tutsi, a Northeast Bantu people.
Ethiopia: E1b1b [62.8%] – A [10.3%] – T [5.1%] – J [3.8%] –
B [1.3%] – E2 [1.3%]
Senegal: E1b1a [81.3%] – E1b1b [6.5%] – E1a [5%] – E2 [2.9%]
Tanzania: E1b1a [48.2%] – E1b1b [21.8%] – E2 [16.4%] –
B [9.1%] – A [2.7%] – T [1.8%]
Ghana: E1b1a [92.3%] – E1a [2.2%] – E1b1b [1.1%]
Kenya: E1b1a [51.7%] – E2 [17.2%] – A [13.8%] – E1b1b [13.7%] –
B [3.4%]
Bantu: E1b1a [54.7%] – E2 [21.2%] – B [10.9%] – A [5.1%] –
E1b1b [4.4%]
Zulu: E1b1a [55%] – E2 [21%] – B [20%] – A [3%]
Congo: E1b1a [63.9%] – E2 [19.4%] – E1b1b [13.9%] –
A [2.8%]
Nigeria: E1b1a [68.2%] – B [9.6%] – E2 [6.9%] – E1a [4.5%] –
E1b1b [3.9%] – A [2.7%]
Rwanda: E1b1a [80%] – B [15%] – E2 [4%] – E1b1b [1%]
Khoisan: E1b1a [35.7%] – A [33.3%] – E1b1b [14.7%] –
B [12.4%] – E2 [3.9%]
Namibia: A [64%] – E1b1a [18%] – E1b1b [9%]

Haplogroup J in Ethiopia is reflective of Arab related peoples and admixture.
Y-DNA Haplogroups E1b1a (V38), E1b1b (M215) and A, are the predominant paternal defining marker Haplogroups for sub-Saharan Africans; with E2 (M75), B and E1a (M132), lesser Haplogroups, yet still distinctive markers for Black men.
Notice that these six paternal Haplogroup lineages are in alignment with the six identified biblical clans descending from Canaan’s sons.

When compared to the core Y-DNA Haplogroups for Japheth’s seven* sons investigated in chapters two to ten – the predominant Haplogroups being O2a, and then O1 with lesser Haplogroups in order C, D, Q, K and N – it is abundantly clear that there is no close connection, only a distant one through the interconnecting Haplogroups of BT and F, later mutations inherited from Japheth and Ham.
The erroneous claim that there are no racial lines and only one race, collapses in a pile when these six key male African Haplogroups for Canaan are contrasted with the seven* primary paternal Haplogroups for the East Asians, Central Asians and Amerindians.
Haplogroups are the scientific evidence that races exist within humankind. Not that mankind is one race. This is non-sensical reasoning, all in the endeavour to be pseudo-politically correct and not offend anyone – refer finalis verbum.

The genetic variation for Canaan’s six lineal descendants are highlighted above in the six regions comprising West Africa, Central and South Africa to East Africa, Horn of Africa and North Africa; including the six colours of mauve, medium blue and light blue to purple, medium green and light green.
Ethiopia is located in the Horn of Africa and its population is 137,326,802 people, the second highest in sub-Saharan Africa. By the year 2100, its population is forecast to be the seventh highest in the world with an impressive 367,290,000 people.
Flag of Ethiopia, constituting the pan African colours: green, yellow and red
The largest ethnic group in Ethiopia is the Oromo; of which it is their Y-DNA Haplogroup spread used rather than the combined population, as it affects the E1b1b, A and J percentages significantly.
Kenya in East Africa has the sixth highest population with 58,127,349 people.
The Democratic Republic of the Congo is in Central Africa, with the third highest population of 114,775,225 people.
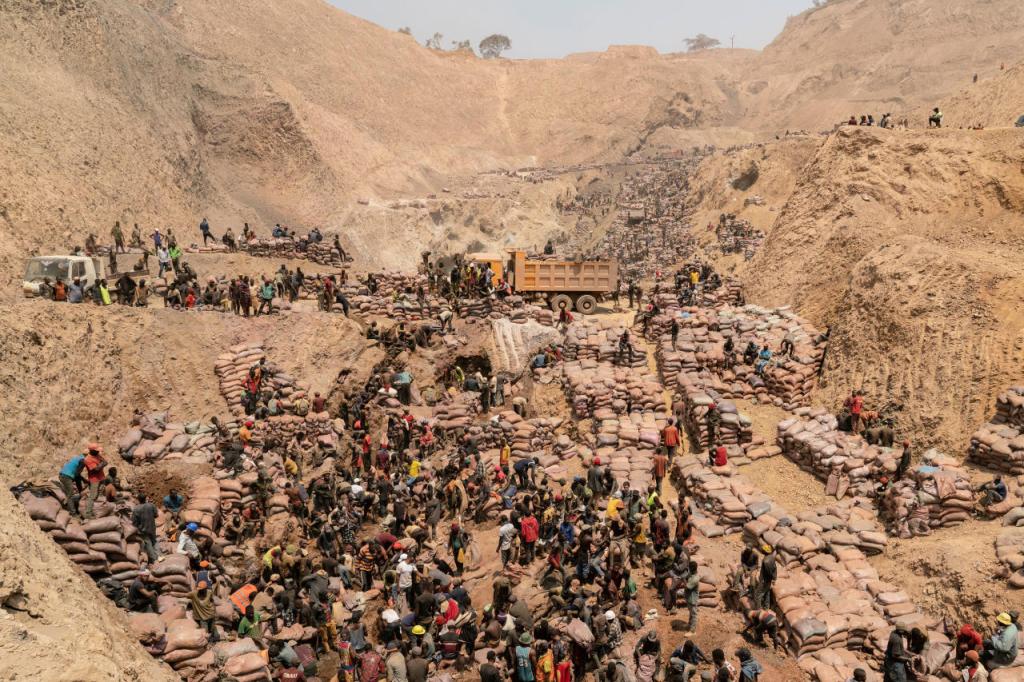
War torn Congo
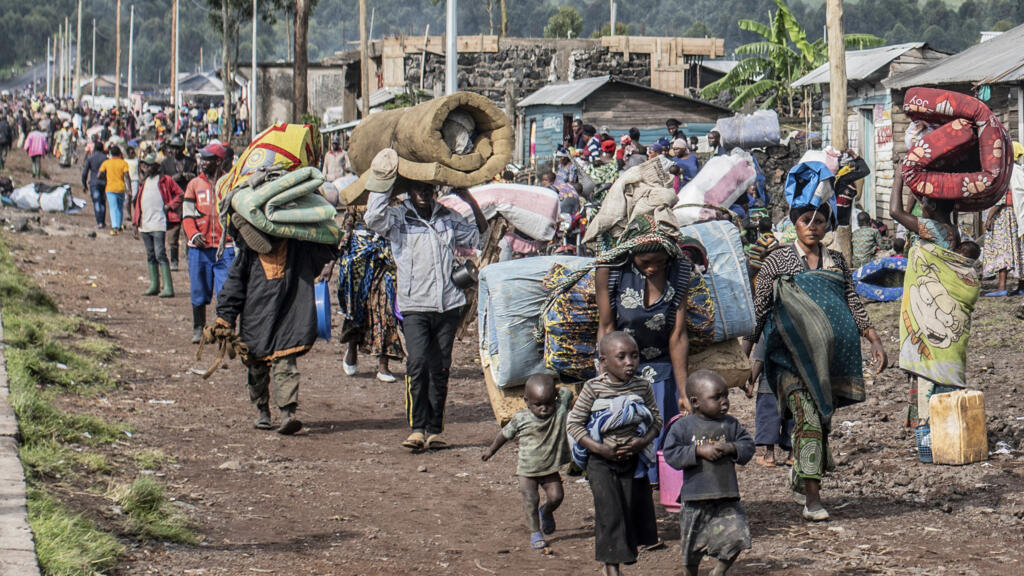
By 2100, the Congo is expected to have the fifth highest population in the world – surpassing the United States – with 430,709,000 people.
Flag of DR Congo
The main ethnic group in the Congo are the Kongo and in Nigeria it is the Igbo.
Tanzania in East Africa, has the fourth highest population with 71,627,811 people. Ghana in West Africa, has a population of 35,408,570 people – the tenth highest.
In the South, the Republic of South Africa has the fifth highest population of 65,145,365 people, in which the vast majority are Black. The Y-DNA Haplogroups of the largest ethnic group, are taken from the Zulu.

Y heat map of current concentrations of the Y-DNA Haplogroup mutation of E1b1a1 (M2) derived from E1b1a (V38)
A comparison table of the sub-Saharan African peoples discussed in this chapter and their Y-DNA marker Haplogroups.
A B E1a E1b1a E1b1b E2 E
Namibia 64 18 9 27
RSA Khoisan 33 12 36 15 4 55
Kenya 14 3 52 14 17 83
Ethiopia 10 1.3 63 1.3 64
RSA Bantu 5 11 55 4 21 80
RSA Zulu 3 20 55 21 76
Nigeria 3 10 5 68 4 7 79
Tanzania 3 9 48 22 16 86
DR Congo 3 64 14 19 97
Rwanda 15 80 1 4 85
Senegal 5 81 7 3 96
Ghana 2 92 1 95
There is a correlation between the percentage of Haplogroup A and E1b1a or Haplogroup E overall. The higher Haplogroup A, the lower generally Haplogroup E and vice versa. As the Namibians are at one end with the highest percentage of Haplogroup A, it is the people of Ghana with E1b1a and the Congo, with E overall which are the other bookends.
Haplogroups A, B and E are three of the five oldest or original Y-DNA Haplogroups. Thus, if Adam possessed Haplogroup A, this then passed along the line of Seth to reach Noah. Regardless, in this instance ostensibly Canaan – though in reality, Noah; refer Chapter XI Ham Aequator – carrying A, passed on the future mutations for Haplogroups B and DE which would later be exhibited in Canaan’s male descendants.
Therefore, it is Canaan for whatever reason, whose male descendants have inherited and retained the oldest and original Haplogroups comprising A and B; while also predominantly carrying Haplogroup E.
The highest percentages of Haplogroup A is found in southern Africa and particularly the Khoisan, Zulu and Bantu males of South Africa.
Haplogroups E1a and E2 prevalent in subequatorial Africa, are unique to Black Africans.
It is Haplogroup E1b1a which is the dominant sub-Saharan paternal Haplogroup, much like O2a1 is in East Asia and South East Asia.
The next most frequent Haplogroup E1b1b* – and second to E1b1a – is an interesting Haplogroup as we shall discover, for it is not just found in sub-Saharan Africa, but is widespread in North Africa; with relatively high concentrations in parts of southeastern and southern Europe.
As clades of E1b1b* from intermixing and intermarriage are found in Shem’s descendants – refer Chapter XXIV Arphaxad & Joktan: Balts, Slavs & the Balkans.
While the Berbers of North Africa are somewhat mysterious in that:
a. are they an Arab related people who have intermarried with Canaanites; or
b. Canaanites who have intermixed with Arabs – Chapter XIV Mizra: North Africa & Arabia.
The next chapter discusses the eldest and most influential of Ham’s sons.
People with understanding want more knowledge, but fools just want more foolishness.
Proverbs 15:14 New Century Version
“The fact that an opinion has been widely held is no evidence whatever that it is not utterly absurd; indeed in view of the silliness of the majority of mankind, a widely spread belief is more likely to be foolish than sensible.”
Bertrand Russell 1872 – 1970
© Orion Gold 2020 – All rights reserved. Permission to copy, use or distribute, if acknowledgement of the original authorship is attributed to orion-gold.com