Chapter XXIV
Shem’s third son is Arphaxad.
He is a mysterious figure in the shadow of his four brothers. Unlike Elam, Asshur and Lud, who all had singular, distinct nations descend from them, Arphaxad – in the vein of his younger brother Aram – is the progenitor of the most nations in the world from a diversity perspective (following Canaan) and the second highest in sheer number (after Canaan) – refer Chapter XII Canaan & Africa.
He is not though, the direct ancestor of one nation; but is the indirect ancestor of a great number. By elimination, it is now obvious to the constant reader that the remaining European peoples in Europe and the New World, descend from Arphaxad.
To add to Arphaxad’s enigmatic aura, the meaning of his name is baffling.
Two proposed are boundary of the Chaldeans and stronghold of the Chaldees. The Chaldeans did descend from Arphaxad, but seemingly quite a few generations later; as the Hebrew word which Chaldee is derived from is Chesed or Kesed, a son of Nahor – Abraham’s brother (Chapter XXV Italy: Nahor & the Chaldeans).
A H Sayce confirms the difficulty in defining Arphaxad – The Races of the Old Testament, 1891, page 64:
‘In the tenth chapter of Genesis Arphaxad is the brother of Aram. He is placed next to Asshur with whom therefore he would have been in geographical contact. Now Arphaxad is written in the original Hebrew Arpha-Chesed, the Arpha of Chesed. What Arpha means is doubtful. Professor Schrader connects it with the Arabic urfak and accordingly renders the name the territory of Chesed. Up to the present no light has been cast on the word by the Assyrian texts.’
Abarim Publications – emphasis & bold mine:
‘… In Greek this name is spelled… Arphaxad… The name Arpachshad is probably extremely old and from a language that’s long since gone. And thus the original meaning of this name is unclear. BDB Theological Dictionary suggests that it is a combination of ‘rp (not in Hebrew but in cognate languages) meaning extent, border…
The name Arpachshad is difficult to interpret. Since both (a-r-p) and (k-sh-d) do not exist in Hebrew, we should look for a possible combination of smaller words: The Hebrew word is used once, as a contraction of the word (the Nile; Amos 8:8), which in turn may be derived from (‘or), light.
It may even be a contraction of (‘arar), curse. Or (‘ara), pluck or gather, with derivative (‘ari), lion… (pak) means flask or vial, from the root (pkk), an unused root that probably means trickle… (puk) denotes a black powder that was used as eye make-up (Jeremiah 4:30, 2 Kings 9:30)… (ke) means as if, but never occurs as a particle. For the sake of brevity (Arpachshad is already an unusually long name)… may be a contraction of (peh), mouth, or (poh), a particle denoting here or hither… (shed) is usually translated with demon, or the object of child sacrifice (Deuteronomy 32:17). (shod) means havoc… (shad) means breast, bosom.
Whatever the name Arpachshad may mean, the meaning is deeply hidden.’
Abarim Publications have helpfully broken the name down to its component parts. Highlighted are those that most closely resemble in this writer’s view, Arphaxad’s name – Or-pak-shad, meaning for example: life from within the heart.
Light gives life and warmth, while the breast (heart) is connected with the closeness of an embrace, intimacy and the source of strong emotional feelings, to cherish and hold dear as if within a flask.
Was Arphaxad light hearted or did he have a warm heart? He certainly did, if he took young Canaan into his family and raised him as his own – refer Chapter XI Ham Aequator.
Previously, when studying Canaan we looked at the fact his people did not migrate all the way to the African continent like their cousins from Cush, Phut and Mizra. They stopped in the high value real estate land that became known as the Land of Canaan. Canaan’s people may have been so familiar with Arphaxad’s family, that they felt comfortable dwelling near them. For it was Arphaxad’s descendants who founded both Akkadia and Sumer – in the Land of Shinar located later in southern Mesopotamia – northeast of Canaan (refer article: The Pyramid Perplexity).
The Book of Jubilees chapter eight, describes something more sinister:
1 ‘… in the beginning thereof Arpachshad took to himself a wife and her name was Rasu’eja, the daughter of Susan, the daughter of Elam, and she bare him a son… and he called his name Kainam.
2 And the son grew, and his father taught him writing, and he went to seek for himself a place where he might seize for himself a city. 3 And he found a writing which former (generations) had carved on the rock, and he read what was thereon, and he transcribed it and sinned owing to it; for it contained the teaching of the Watchers in accordance with which they used to observe the omens of the sun and moon and stars in all the signs of heaven’ (Astrology and Angelolatry – refer article: Monoliths of the Nephilim).
4 ‘And he wrote it down and said nothing regarding it; for he was afraid to speak to Noah about it lest he should be angry with him on account of it.
5 And… he took to himself a wife, and her name was Melka, the daughter of Madai, the son of Japheth, and… he begat a son, and called his name Shelah; for he said: ‘Truly I have been sent.’ 6… and Shelah grew up and took to himself a wife, and her name was Mu’ak, the daughter of Kesed, his father’s brother… 7 And she bare him a son… thereof, and he called his name Eber: and he took unto himself a wife, and her name was‘Azurad, the daughter of Nebrod [Nimrod]…
8 And… she bare him son, and he called his name Peleg; for in the days when he was born the children of Noah began to divide the earth amongst themselves: for this reason he called his name Peleg. 9 And they divided it secretly amongst themselves, and told it to Noah.’
We have addressed Kainam’s birth and his inclusion in Arphaxad’s family; who was born from the incest between Ham’s wife Na’eltama’uk and Noah – Chapter XI Ham Aequator.
For Canaan the stepson of Ham in having found inscriptions regarding Watchers while seeking a city, he would have had to have been in the coastal strip later called (non-coincidently) Canaan.
We have investigated the plague of Nephilim in this area and their base at Mount Hermon – refer article: Nephilim & Elioud Giants II; and Chapter XXXIV Dan: The Invisible Tribe.
The genealogy details have undeniably been tampered with as we have previously discovered. We know this for two reasons as:
a. the line of Arphaxad would not have been dramatically diluted by the line of Canaan so quickly following the Flood and
b. it is unlikely Arphaxad’s grandson Eber, would have taken Nephilim offspring for a wife.
Or, the possibility remains that Eber may have had more than one wife and Azurad was a second wife. The prime line of descent would not have been contaminated so early on in the genealogy of Arphaxad’s family tree with Nephilim DNA. Though that was surely the Watchers’ plan.
The agenda by whoever has written these verses or whomever has edited them, has been to cast aspersion on the line that produced the promised seed of the Messiah, who would ultimately defeat the Serpent’s seed – Genesis 3:15. Verse 1 is impossible and verses 5-7 highly unlikely.
Shelah’s wife from Kesed, is fabricated, or it was a different Kesed to the one born to Abraham’s brother, Nahor. Kesed is not included as a sixth son of Shem. Maybe he was another son from Arphaxad not listed because no known nation has proceeded from him – Genesis 10:11.
There is an interesting similarity between Nimrod’s daughter Azur-ad and Assur, as it can be spelled without the h – refer Chapter XX Will the Real Assyria Stand Up: Asshur & Russia; and Chapter XXI The Incredible Identity, Origin and Destiny of Nimrod.
The Book of Jasher chapter seven, lists three sons for Arphaxad, whereas the Bible concentrates on the eldest, Shelah:
16 … and the sons of Arpachshad were
Shela-c-h, Anar and Ashcol.
Genesis 11:10-13
English Standard Version
‘These are the generations of Shem. When Shem was 100 years old, he fathered Arpachshad two years after the flood. And Shem lived after he fathered Arpachshad 500 years and had other sons and daughters. When Arpachshad had lived 35 years, he fathered Shelah. And Arpachshad lived after he fathered Shelah 403 years and had other sons and daughters.’
We learn that Arphaxad had other sons and daughters. Added to the account in the Book of Jubilees, these additional sons and brothers comprised those peoples who would establish the early cities in the lower Mesopotamian delta region. Akkadia, a legacy from the name Arphaxad in the northwest and Sumer, derived from the name Shem in the southeast. The descendants of Arphaxad’s great grandsons Peleg and Joktan, constituted the dominant peoples of Akkadia and Sumer respectively.
The ageing process changed after the Flood, in that Noah and his sons lives were shorter than if the antediluvian atmosphere and climatic conditions had remained (containing a higher Carbon dioxide to Oxygen ratio) – refer article: The Younger Dryas Stadial: Ending of the Earth… Beginning of the World; and Chapter I Noah Antecessor Nulla.
Whether DNA manipulation was involved is conjecture, though cannot be dismissed. The ages after the Flood were still yet impressive and beyond our comprehension. They did not settle into what we know today until approximately beginning with Abraham, who lived to one hundred and seventy-five years of age and his grandson Joseph who lived to one hundred and ten.
Reading Genesis 10:10-13 based on an unconventional chronology – and a sexagesimal interpretation of the rounded numbers in the biblical account (refer Article: Na’amah) – would read as the following:
‘These are the generations of Shem. When Shem was 1,120 years old, he fathered Arpachshad 120 years after the flood. And Shem lived after he fathered Arpachshad 5,000 years and had other sons and daughters. When Arpachshad had lived 1,070 years, he fathered Shelah. And Arpachshad lived after he fathered Shelah 4,030 years and had other sons and daughters.’
Thus the corresponding adjusted dates mean Arphaxad was born circa 10,717 BCE, his son Shelah in 9647 BCE, his son Eber in 8747 BCE and his son Peleg in 7727 BCE. Nimrod was born circa 8700 BCE and the Tower of Babel, with the confounding of the single language into many and all the peoples dispersing from the Middle East occurred between approximately 6755 to 6232 BCE – Article: The Pyramid Perplexity.
It was circa 4000 BCE or earlier that Sumerian civilisation suddenly appears fully formed with extensive records.
Staggeringly, Noah lived until 7337 BCE. Shem died in 5717 BCE and Arphaxad passed away in 5617 BCE.
Abraham’s father Terah, was born 4077 BCE. We have considered how Terah may have worked for Nimrod. Nimrod if still alive would have been about 5,700 years old. Quite possible (yet improbable, refer Chapter XIX Chedorlaomer & the War of Nine Kings), as he was not only a first generation Nephilim, but could have feasibly lived this long as a full human being, for Arphaxad lived for 5,100 years. It wasn’t until 1977 BCE that Abraham was born and threrefore accounts of Abraham fleeing from Nimrod or slaying him are not reliable.
Abarim Publications explain Arphaxad’s son Shelah’s name, with two interpretations.
‘There are two completely different Hebrew names in the Bible that are commonly both translated with Shelah. But they’re spelled different and they mean different things. We’ll call them Shelah I and Shelah II:
The name Shelah I… Meaning Missionary, Emissary From the verb (shalah), to send.
The only Shelah I (probably more properly pronounced as Shelach) of the Bible is a son of Arpachshad, son of Shem… (Genesis 10:24). This Shelah was an ancestor of Christ and is mentioned by Luke (Luke 3:35). The prophet Nehemiah makes mention of a Pool of Shelah in Jerusalem (3:15), which refers to Shiloah or Siloam in Greek. The verb (shalah) means to send; to send whatever from messengers to arrows. It may even be used to describe a plant’s offshoots or branches. Noun (shelah) refers to some kind of weapon, apparently a kind of missile. Plural noun (shilluhim) means a send-off; a sending away or parting gift. Noun (mishlah) describes an outstretching of one’s hand (i.e. an undertaking, or referring to the place where the letting go takes place)…the name Shelah may mean Sent Out, Branch or Javelin.
The name Shelah II… Meaning Extracted… Prosperity, Request, Petition… From the verb (shala), to extract or de-employ. From the verb (sha’al), to ask or request… Shelah, a son of Judah with the unnamed daughter of Shua (Genesis 38:5). This Shelah became the progenitor of the Shelanites (Numbers 26:20). The town of Shiloh… The verb (shalal) means to extract, mostly in the sense of to plunder. Adjective (sholal) means barefoot. Noun (shilya) means afterbirth. Perhaps a second verb (shala) means to be at rest and prosper… Nouns (shalu) and (shalwa) mean prosperity. Adjectives (sheli) and (shalew) mean quiet, private or prosperous.
The name Shelah means all of the above, but would probably be interpreted to mean either Prosperity or Booty. Jones’ Dictionary of Old Testament Proper Names disagrees with all these obvious similarities, and takes the name Shelah to… meaning request or petition [such as by Prayer]…’
Shelah’s son was Eber, with Abarim Publications saying the following – emphasis mine:
‘The name Eber:
Meaning The Region Beyond, One From Beyond, He Who Passed Over, From the verb (‘abar), to pass over [and also ‘to cross over’].
There are five Ebers mentioned in the Bible:
The father of Peleg… (Genesis 10:24).
A Gadite chief (1 Chronicles 5:13).
A son of Elpaal of Benjamin (1 Chronicles 8:12).
A son of Shashak of Benjamin (1 Chronicles 8:22).
The chief of the Levitical family of Amok when Joiakim was high priest in post-exilic Israel (Nehemiah 12:20).
The first Eber marks an important point in the Biblical genealogies, as of Shem it was said that he was the father of ‘all the children of Eber’. And in the days of Peleg, the son of Eber, ‘the earth was divided’ (Genesis 10:25). The sons of Joktan, Peleg’s brother, are the last mentioned Shemite generation before the tower of Babel was built.
Peleg became the ancestor of Abraham, who was the first to be called Hebrew, a word that is highly similar to the name Eber.
The name Eber comes from the verb (abar) meaning to pass through: The important verb (‘abar) means to pass or cross over (a river, border, obstacle or terrain). The derived noun (‘eber) describes what or where you end up when you do the verb: the other side or region beyond.’
It is interesting to note that in Genesis chapter ten, before any of Shem’s sons are listed, Shem is listed first, as the father of all the children of Eber. It is from Eber that the term Hebrew derives and refers principally to the the sons of Jacob, who became known as Hebrews. We will learn later that etymologically derived words from Eber are located in Western Europe and help trace some of the sons of Jacob.
The Origin of the Nations, Herman Hoeh, 1957 – emphasis mine:
‘Notice Arphaxad first. He is a son of Shem. He is mentioned in Genesis 10:22 and I Chronicles 1:24. Arphaxad had a grandson named Eber. The name Eber mens a “migrant,” one who comes from the “region beyond.” The sons of Eber are properly known as “Hebrews” – and there are about 400 million of them on earth today! Yet almost no one really knows who the sons of Eber – the Hebrews – are at this time!
Eber had two sons reckoned to him. It was in their day, about 100 [4,000] years after the flood, that God “divided the earth” as an inheritance for the different family groups (Genesis 10:25 and Deuteronomy 32:8). From Peleg, one of these two sons, came Abraham. God promised Abraham that his descendants would be as numerous as the dust of the ground. The Jews are certainly not as numerous as the dust. Only a tiny fraction of Abraham’s descendants are known as Jews today!’ – refer Chapter XXIX Esau: The Thirteenth Tribe.
‘Where are the others?’
Eber’s second son Joktan, or possibly Peleg’s twin due to phrasing, represents a major division within Arphaxad’s line and today is represented by those nations we label Eastern Europe. Joktan had an impressive thirteen sons who are listed in Genesis and 1 Chronicles.
The peoples of Eastern Europe fall into three main categories; those more closely related to the Russians (Asshur) in north eastern Europe; those with an affinity with Austrians in central Europe; and those peoples similar to southern Italians. As there are more than thirteen nations in Eastern Europe, we will endeavour to identify thirteen lines of lineal descent and isolate any variations as evidenced by Haplogroups and autosomal DNA.

Genesis 10:25-30
English Standard Version
‘To Eber were born two sons: the name of the one [H259 – ‘echad: the other, another. Not word used for first] was Peleg, for in his days the earth was divided, and his brother‘s [H251 –‘ach: half-brother] name was Joktan.‘
It is also possible that Peleg and Joktan were half brothers with different mothers.
‘Joktan fathered
Almodad, Sheleph, Hazarmaveth, Jerah, Hadoram,
Uzal, Diklah, Obal, Abimael,
Sheba, Ophir, Havilah, and Jobab;
all these were the sons of Joktan.
The territory in which they lived extended from Mesha in the direction of Sephar to thehill country of the east [the Arabian Peninsula].’
Notice, a Sheba and a Havilah.
The same names repeated from the discussion on the sons of Cush:the northern Indians of India and the nation of Bangladesh respectively – refer Chapter XIII India & Pakistan: Cush & Phut.
There is an Uz-al, similar to the Uz of Aram in Italy – refer Chapter XXIII Aram & Tyre: Spain, Portugal & Brazil.
The four names in italics are the sons mentioned in the Bible outside of Genesis ten and I Chronicles one. It is probable that these four are the biggest or most prominent brothers, as the Bible tends to give air time to the most influential or well known nations in any family group – particularly, from an interaction with the sons of Jacob perspective.
Ophir was once famously renowned for its wealth from trade in the ancient world.
The youngest son, Job-ab, is a family name replicated in Nahor’s descendants – Article: Job.
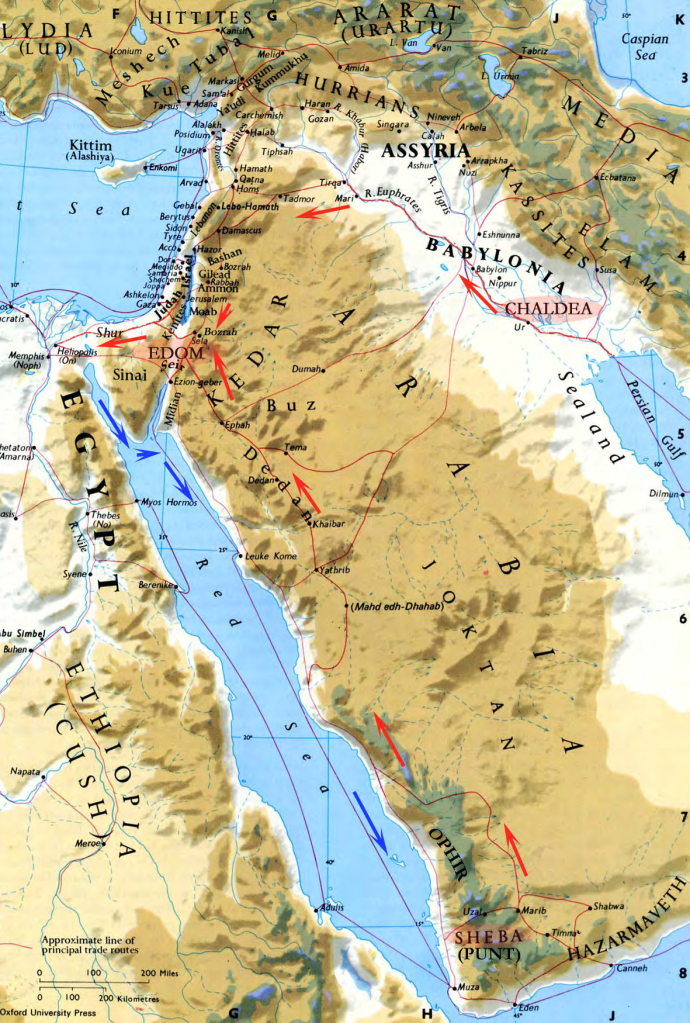
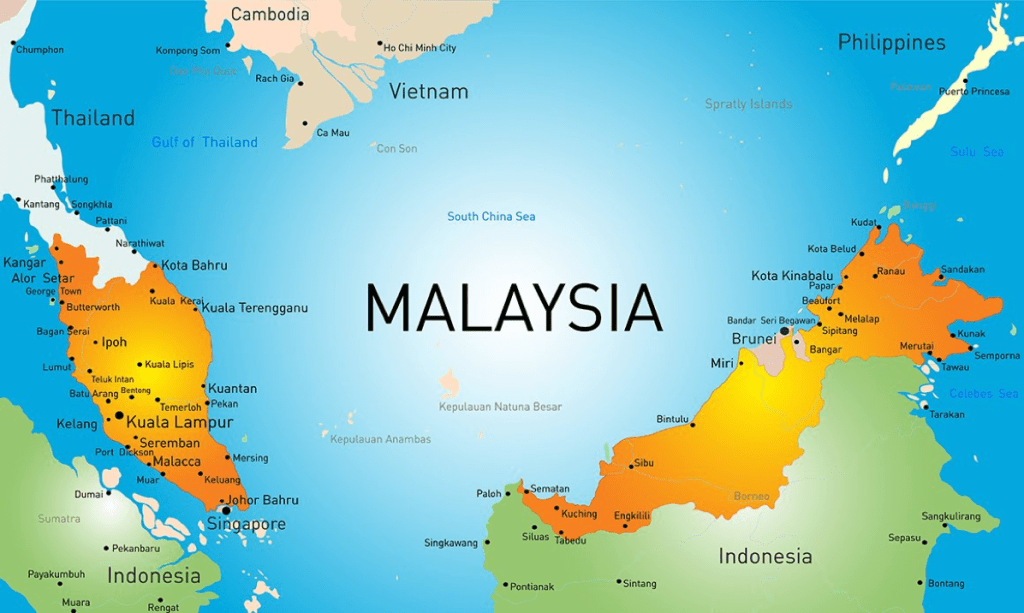
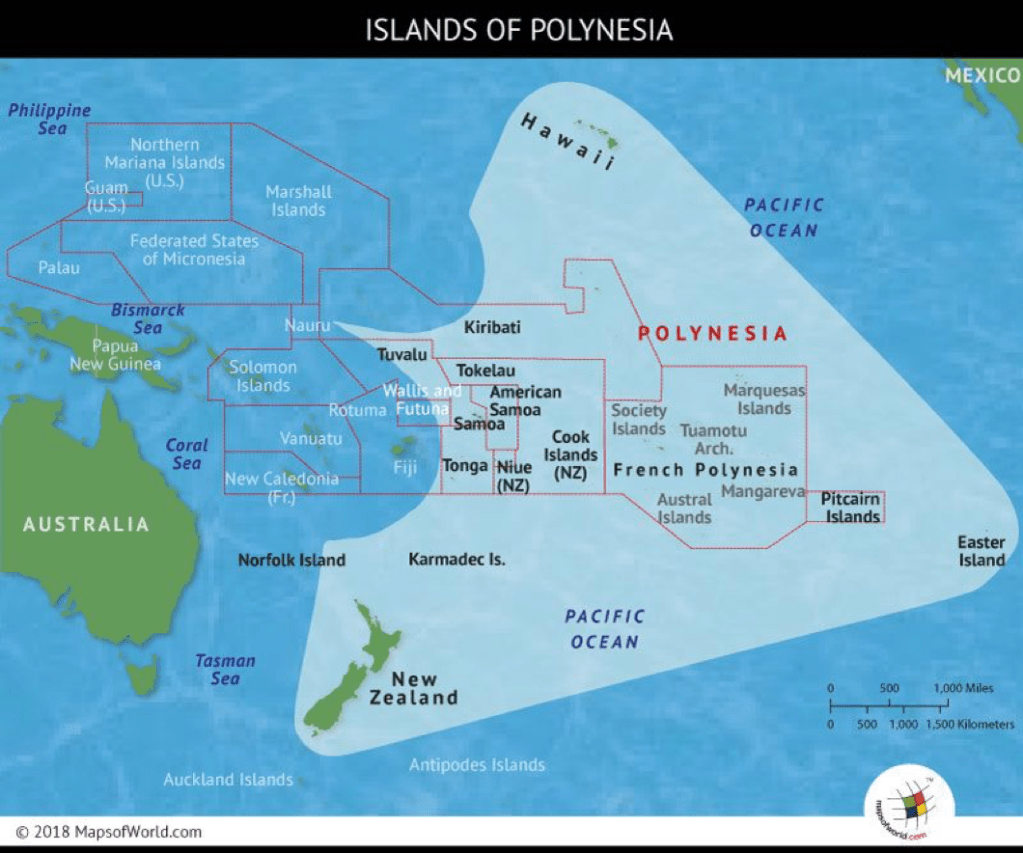
A detailed Map of the ancient Middle East showing the locations of Shem’s descendants; notice Joktan’s region and specifically the land of Ophir.
The children of Joktan prior to migrating to the Arabian Peninsula, originally dwelt to the east of Arphaxad’s other children who had descended from Peleg. Anciently, Sumer was southeast of Akkadia and today, Joktan lives to the east of Peleg’s descendants. Both peoples descended from Arphaxad and both originally spoke Sumerian. Scholars have proposed that Akkadia, or Babylon spoke Chaldee which was a branch of Aramaic. Chaldee was introduced later, with the arrival of the Chaldean ruling elite – Chapter XXV Italy: Nahor & the Chaldeans.
Prior to that, the primeval language of Babylon and for all the Land of Shinar was Sumerian; a language with no certain affinity to any other known language – Chapter XVIII – Elam & Turkey.
A number of researchers have either thought that the reference to the east, coupled with so many sons indicates that Joktan must be China; or that other references in the Bible stating Arabia and Ishmael are a link to the Arabic world.
Both are incorrect summations as we have already observed regarding the identities for China and the Arab related peoples – refer Chapter X China: Magog, Tubal & Meshech; and Chapter XIV Mizra: North Africa & Arabia.

Abarim Publications – emphasis & bold mine:
‘The name Joktan, meaning: He Will Be Small from the verb (qaton), to be small.
Joktan is a son of the famous Eber, his brother being Peleg, the forefather of Abraham (Genesis 10:25). The name Joktan is the active form of the verb (qaton) meaning to be small or insignificant: Adjectives (qatan) and (qaton) mean small, young or insignificant. Noun (qeton) refers to the little finger.
For a meaning of the name Joktan, NOBSE Study Bible Name List reads He Will Be Made Small. A name of similar meaning is Paul.’
Hitchcock’s Bible Names dictionary says for Joktan:
‘small dispute’ or ‘contention’ and ‘disgust.’
There must be no small irony in the name, as the peoples descended from Joktan are far from small in number. It could be argued that they are not as large a presence on the world stage as other nations. In this, the name is reliably indicative of the peoples descended from Joktan. Historically, the Slavs – argued as deriving from Slaves – Balts and the Balkans have been trodden underfoot by the bigger aggressor nations to their east, west and south: Russia, Germany and Turkey respectively.

For simplicity the twenty-two modern nations which include:
Finland, Estonia, Latvia, Lithuania,
Belarus, Ukraine, Poland, Czech Republic, Slovakia, Hungary,
Moldova, Romania, Bulgaria, Greece, Albania
and the peoples of the former Yugoslavia –
North Macedonia, Slovenia, Croatia, Bosnia-Herzegovina, Serbia, Montenegro and Kosovo –
broadly comprise Joktan‘s descendants today.
What has to be remembered is that according to the Bible and the Book of Jasher, Arphaxad had other sons, Anar and Ashcol and thus the surplus of nations – exceeding the number thirteen – could be more closely related to these sons and not necessarily from Joktan specifically.
Using a genetic measure could resolve the conundrum, in that subtracting the seven nations of the former Yugoslavia, excepting Slovenia, North Macedonia and Kosovo, as well as Finland, Estonia, Latvia and Lithuania for reasons which will become apparent would leave thirteen nations.
North Macedonia has strong ethnic and geo-political ties with Bulgaria and leans towards Joktan; while Kosovo is comprised of 92.93% Albanians and could count as one with Albania. Hence twenty-one nations less the thirteen peoples from Joktan leaves the four Baltic nations and the four remaining Balkan nations.
All these countries singularly have smaller populations of ten million people or less – the exceptions being Ukraine, Poland and Romania – with the smallest being Montenegro with 628,272 people.
We will gradually refine the possibilities as we progress and a clearer picture will be brought into focus.
Genesis 25:17-18
English Standard Version
17 ‘(These are the years of the life of Ishmael: 137 years. He breathed his last and died, and was gathered to his people.)
18 They settled from Havilah to Shur [to be raised, wall, fort, bull], which is opposite Egypt in the direction of Assyria.
He settled over against [in hostility towards] all his kinsmen.
This verse has prominent clues to where Ishmael is living today, which we will look into further in Chapter XXVIII The True Identity & Origin of Germans & Austrians – Ishmael & Hagar.
The Havilah mentioned in this verse, is not the Havilah of Bangladesh descended from Cush. In 1 Samuel 15:7, Havilah is mentioned in connection with Esau’s grandson, Amalek. Another major clue, which will become clearer later in our study.
Havilah is associated with gold – Genesis 2:11-14. In Chapter XIII India & Pakistan: Cush & Phut, Havilah from Cush was considered as being referenced in this passage about Eden. Researchers (this writer included), have not thought to link Havilah with Joktan’s son of the same name. Yet the reference to gold is a clue of key importance. Bangladesh is not known for gold deposits. A handful of eastern European nations are. It would seem then, that this Havilah described with Cush and critically Assyria, is actually the son of Joktan and not the son of Cush.
Gold is also a theme for two of the other three sons of Joktan mentioned in scripture. Of the twenty-two nations possibly associated with Joktan, four stand out in either their current gold mining production or alternatively have large potential reserves.
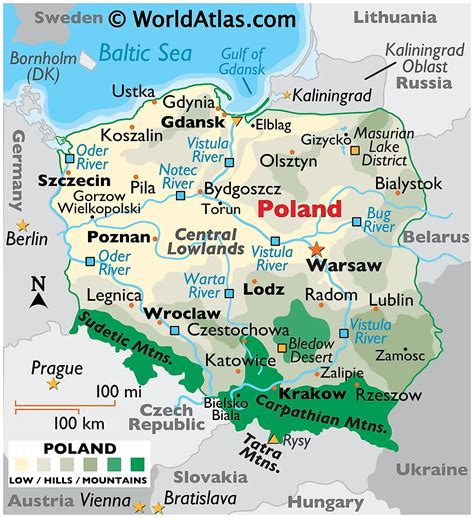
Due to the geographic clues described in these two verses – relating to Ishmael, Shur and Asshur (the Russians) – Havilah, the twelfth son of Joktan equates with the modern nation of Poland.
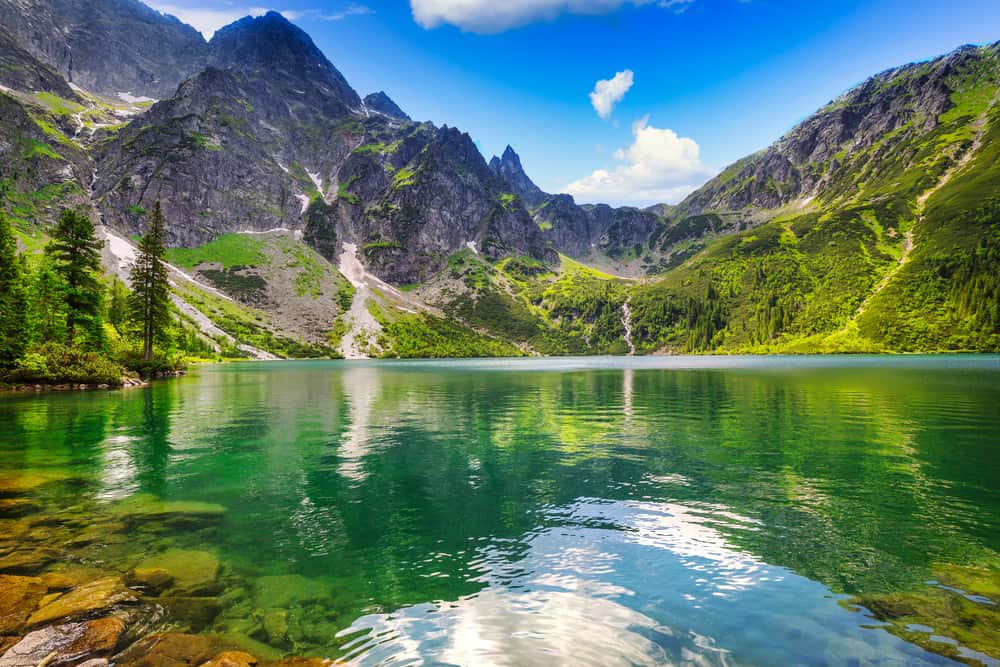
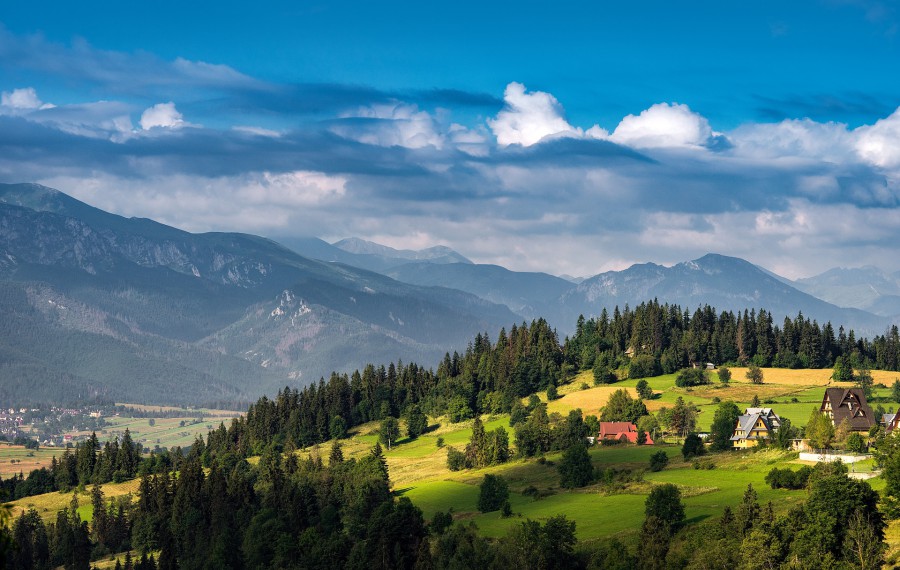
Tatra Mountains
The definition of Havilah is detailed in the section on Cush and Phut. Briefly, it means ‘tremble’ or ‘languish.’ The history of Poland has been severe, with both the Germans and Russians, especially cruel. Poland has certainly been left to languish, which means: ‘to be or become weak or feeble; droop; fade, suffer hardship and distress.’
The population of Poland is 37,887,046 people – marginally lower than Ukraine.
Rare Gold Nuggets – emphasis mine:
‘The potential for undiscovered gold deposits to be found in Poland is still there, even though the country has been mined for centuries. The many deposits that are out there are signs of just how impressive the natural resources of this unique country truly are.’
The name ‘Poland’ derives from the West Slavic tribe called the Polans (Polanie), who inhabited the region during the early Middle Ages. While the term Polanie is believed to derive from the Old Slavic word ‘pole’, meaning ‘field’ or ‘open land’ reflecting an agricultural lifestyle and settlement in fertile areas.
The Polans expanded their influence and united various Slavic tribes in the tenth century and so their name became associated with the entire region. The first historically recognized ruler of Poland, Mieszko I, played a significant role in establishing the first unified and centralised state, the Civitas Schinesghe. Mieszko was Duke of Poland from 960 until his death in 992.
The Latin name for Poland, ‘Polonia’, emerged during this time and is used in many European languages.
Poland has also been referred to as Lechia – an ancient name derived from Lech, the legendary founder of Poland – and today as Rzeczpospolita; the official name meaning, Republic of Poland.
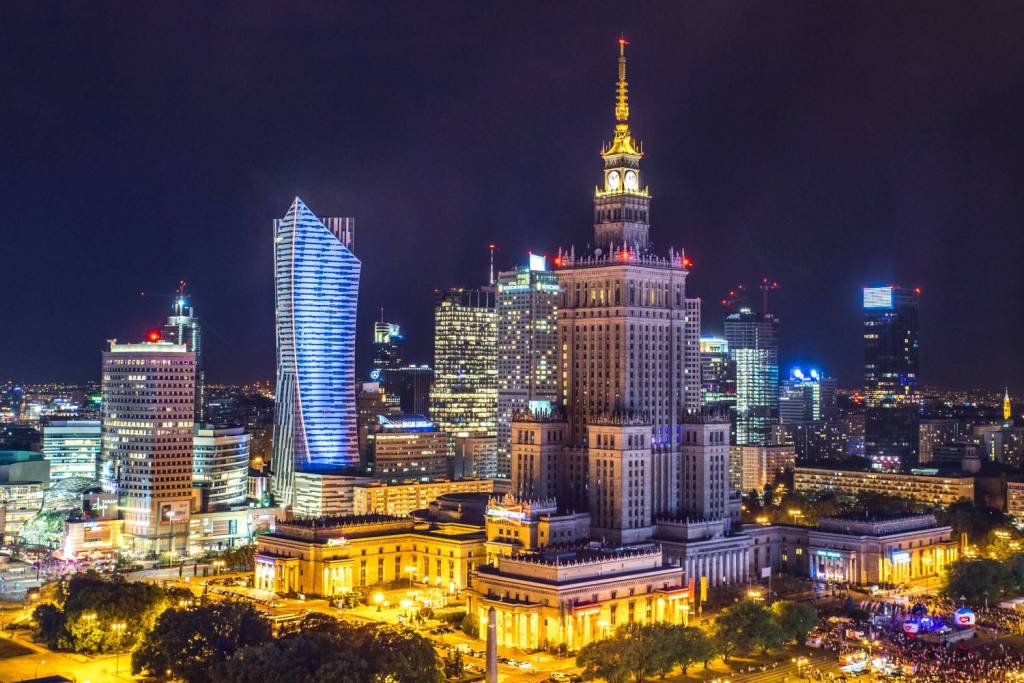
Capital of Poland, Warsaw
Lech Wałęsa, a Polish statesman, dissident and Nobel Peace Prize laureate; served as the President of Poland between 1990 and 1995. After winning the 1990 election, Wałęsa became the first democratically elected President of Poland since 1926 and the first-ever Polish President elected by popular vote.

A Gdansk shipyard electrician by trade, Wałęsa became the leader of the Solidarity movement and led a successful pro-democratic effort, which in 1989 ended Communist rule in Poland; ushering in the end of the Cold War with the fall of the Berlin Wall (1989) and the collapse of the Soviet Union (1991).

Polish man and woman

Poland has the 20th largest economy in the world, with a 2025 GDP of $979.96 billion – and is the leading economy of the sons of Joktan.
Heavy industry, iron and steel production, machinery manufacturing, shipbuilding and coal mining, are all vital components of Poland’s economy. ‘Poland’s business friendly climate and sound macroeconomic policies allowed it to be the only EU country to avoid recession in the aftermath of the 2008 financial crisis.’
Flag of Poland and Coat of Arms
Over the past decade, Poland has significantly increased its military strength, spurred on by the Russian invasion of Ukraine on its door step. Poland now ranks as NATO’s third-largest military with approximately 216,100 personnel.
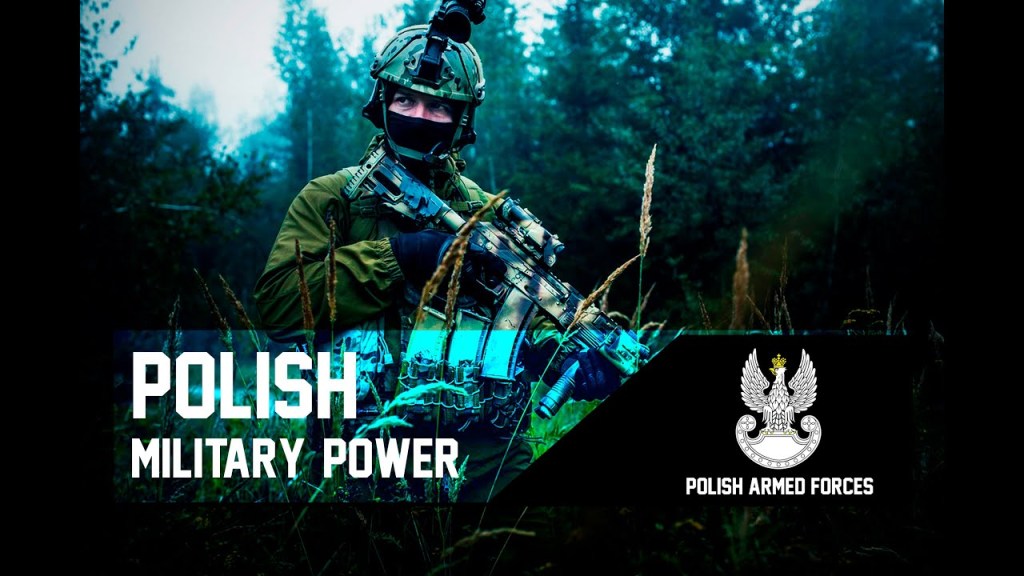
Poland ranks 22nd in the 2025 Military Power Rankings (MPR) – marginally behind Ukraine.
The country allocates 4.12% of its GDP to defence – the highest in NATO – investing heavily in modern equipment and recruitment to enhance its capabilities in land forces; air defence systems; and missile strike capabilities. Poland has positioned itself as a leading military force in Central Europe with the ability to mobilise at scale in response to crises on NATO’s eastern flank.
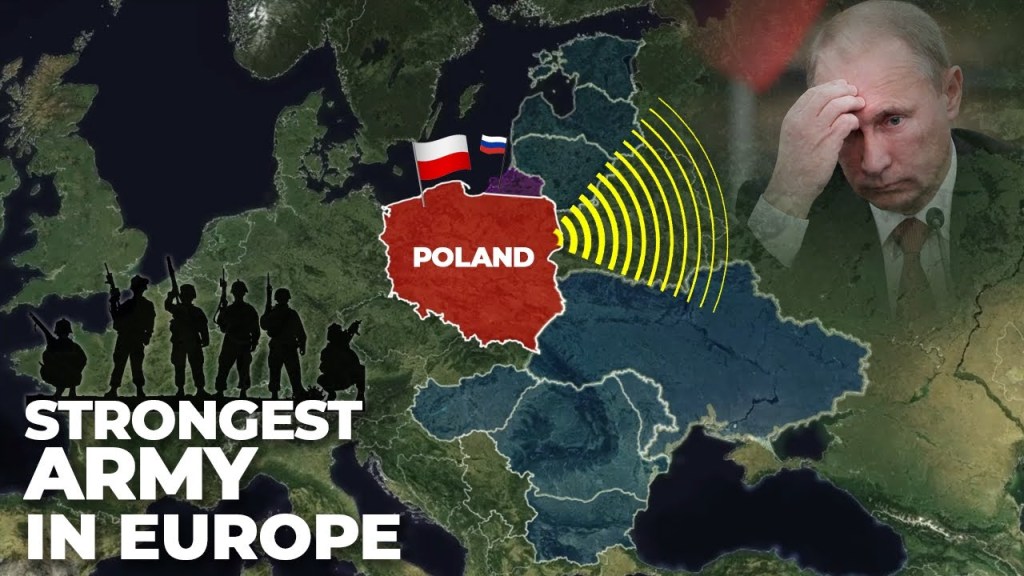
As a frontline NATO member and critical actor in Eastern European security, Poland maintains a rapidly modernising military geared toward territorial defence; deterrence against Russian aggression; and alliance-based interoperability.
Ezekiel 27:18-21
Complete Jewish Bible
‘Because you [Tyre-Brazil] were so wealthy, with such a variety of valuable merchandise, Dammesek [Spain] traded wine from Helbon and white wool* with you.
V’dan [Dan or Eden] and Yavan [Greeks… H3120 – Yavan & H3196 – yayin: wine, winebibbers, banqueting, intoxication] from Uzal [H235 – ‘azal: to go away, to disappear, be gone (spent), fail, to go to and fro, gad about] traded ironwork, cassia^ and aromatic cane for your goods.
D’dan [Dedan (Abraham & Keturah)] traded with you for riding gear. Arabia [Abraham & Keturah’s sons] and all the princes of K’dar [Ishmael] were your customers; for your goods they traded lambs, rams and goats.’
Most translations are not faithful to the interlinear translation. The CJB renders it accurately.
Uzal – the sixth son of Joktan – is usually not even named, but translated for instance, as merely ‘traversing back and forth’ in the New King James Version.
The name Javan is interesting and has a double meaning as we have identified previously with Javan in the Book of Daniel. It is the only biblical identity used for Javan from Japheth and the modern territory of Greece. For example, we saw clearly that Cush and Ethiopia are not used this way in scripture – refer Chapter XIII India & Pakistan: Cush & Phut.
This verse is not clear in which Javan is intended. Clues point to both. The word for Javan has a root word and this word means wine. Greeks today drink more wine, with thirty-five percent compared to beer, at five percent.
The phrasing is a cryptic clue to Uzal’s identity as it is like saying: ‘Greece from Greece.’
The reference: ‘going to and fro’ in a trading context is indicative of modern Greece, which is synonymous with shipping and its most important industry, worth some $21.9 billion in 2018.
Ancient Uzal is today the modern day nation of Greece.
Indonesia, a nation of Javan and his son’s descendants the Kittim on the other hand, is the world’s leading cinnamon producer, with 43% of the total world production in 2014. Cinnamon can be made from the cassia^ plant.
Yechezkel 27:19
Orthodox Jewish Bible
‘Vedan also and Yavan (Greece) provided for your wares with fine yarn*; wrought iron, cassia, and cane, were among thy merchandise.’

Greek man and woman

The OJB has translated Uzal as its identifying sign. This is valuable information, as Greece is ranked 18th in the world for wool production; while it is number one in Eastern Europe. Greece is 11th in the world for Cotton production and 7th in worldwide exports. The modern state of Greece should not be confused with the same people as the Classical or Hellenistic Greeks – Chapter XXVI The French & Swiss: Moab, Ammon & Haran.
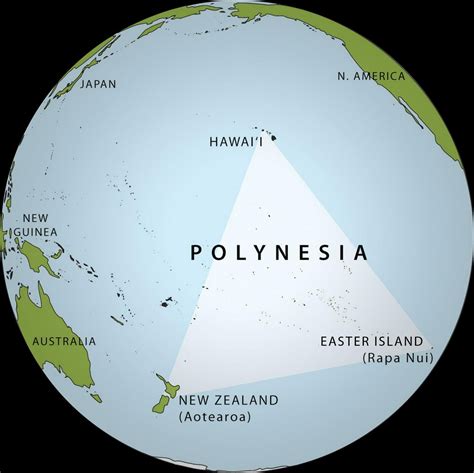
This is a good example of a people settling millennia later in a territory which still retains the original name. In fact, Greece before the ancient European Greeks, was originally the Greece from Javan, the son of Japheth – Chapter VII Javan: Archipelago South East Asia & Polynesia.
The population of Greece is 9,869,404 people.
Rare Gold Nuggets – emphasis mine:
‘Greece is a country that has good potential when it comes to finding gold. Many experts believe that Greece contains some very large gold reserves, many of which are virtually untapped. With that being said, Greek gold production is currently only producing a scant few thousand kilograms of gold per year.’
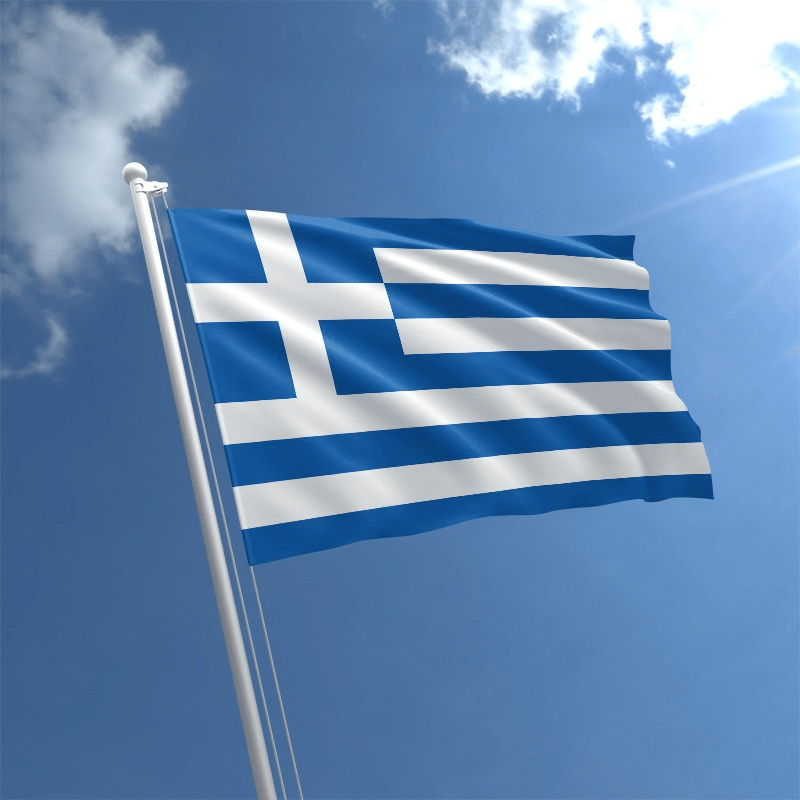
Flag of Greece
Ezekiel 27:21-24
English Standard Version
‘Arabia [Abraham & Keturah] and all the princes of Kedar [Ishmael] were your favored dealers in lambs, rams, and goats; in these they did business with you [Tyre-Brazil].
The ‘traders of Sheba’ [1] and Raamah [India] traded with you; they exchanged for your wares the best of all kinds of spices and all precious stones and gold.
Haran, Canneh, Eden, traders of Sheba [2], Asshur [Russia], and Chilmad traded with you. In your market these traded with you in choice garments, in clothes of blue and embroidered work, and in carpets of colored material, bound with cords and made secure.’
The traders of Sheba in verse 23 are different from the ‘traders of Sheba’ in verse 22. The first being referred, are the Northern Indians; the second Sheba descends from Joktan.
Psalm 72:10, 15
English Standard Version
‘May the kings of Tarshish [Japan] and of the coastlands [East Asia and South East Asia] render him tribute; may the kings of Sheba [India H7614] and Seba [Sri Lanka H5434] bring gifts!
Long may he live; may gold of Sheba [H7614] be given to him…’
Similarly in these verses, two different Shebas are stated, even though it is the exact same Hebrew word for the same name, yet remaining distinct from the other name of Seba using a different Hebrew word.
Rare Gold Nuggets – emphasis mine:
‘Romania is home to the largest gold deposit in continental Europe. Romania is one of the poorer countries in Europe, but from a view of the resources available for mining it is actually one of the richest. There are a large variety of minerals that are commercially mined here. The potential for gold mining in Romania is strong and the history of mining in the country is extensive.’
Sheba – the tenth son descended from Joktan – is Romania.
Like the Greeks, the Romanians have inherited the name from the ancient Romans; though they are not descendants of the Romans themselves.

Romanian man and woman

Similarly, the Magyars in Hungary are not Huns, they simply have the appellation of the former peoples, by that name: the Turks – refer Chapter XVIII Elam & Turkey; and Chapter IV Central Asia – Madai & the Medes.
The population of Romania is 18,840,535 people.
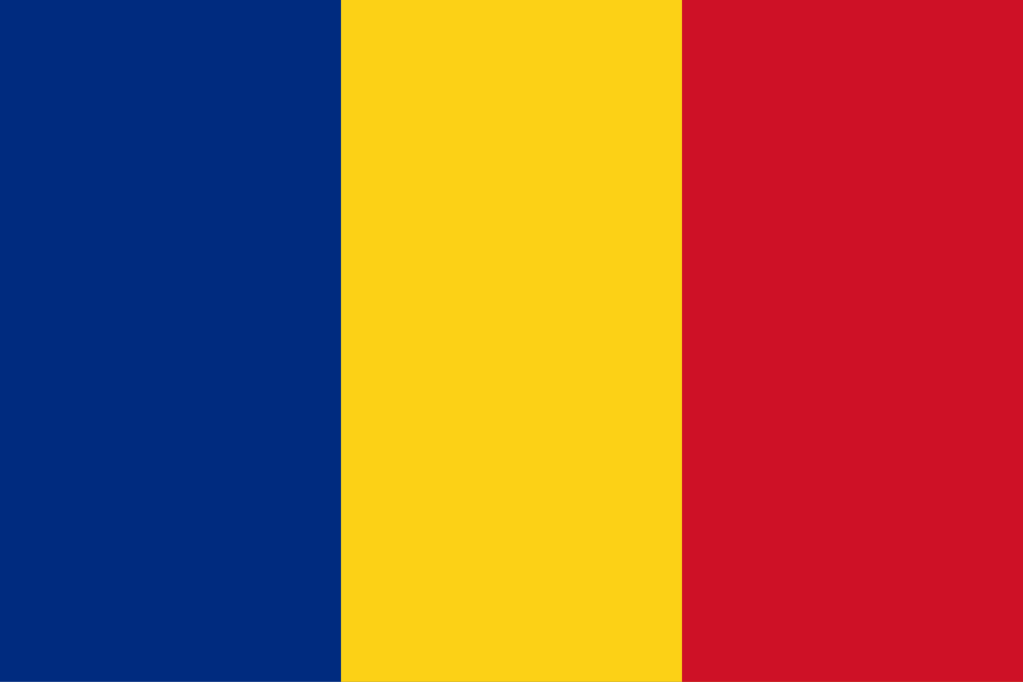
Romanian Flag
1 Kings 22:48
English Standard Version
‘Jehoshaphat made ships of Tarshish to go to Ophir for gold, but they did not go, for the ships were wrecked at Ezion-geber.’
1 kings 10.11
English Standard Version
‘Moreover, the fleet of Hiram [King of Tyre], which brought gold from Ophir [H211 – ‘Owphiyr: ‘gold region in the east’], brought from Ophir a very great amount of almug [H484 – ‘almuggiym: a tree from Lebanon (sandalwood?)] wood* and precious stones.’
Job 28:16
English Standard Version
‘It cannot be valued in the gold of Ophir, in precious onyx or sapphire.’
Psalm 45:9
English Standard Version
‘… daughters of kings are among your ladies of honor; at your right hand stands the queen in gold of Ophir.’
Isaiah 13:12
English Standard Version
‘I will make people more rare than fine gold, and mankind than the gold of Ophir.’
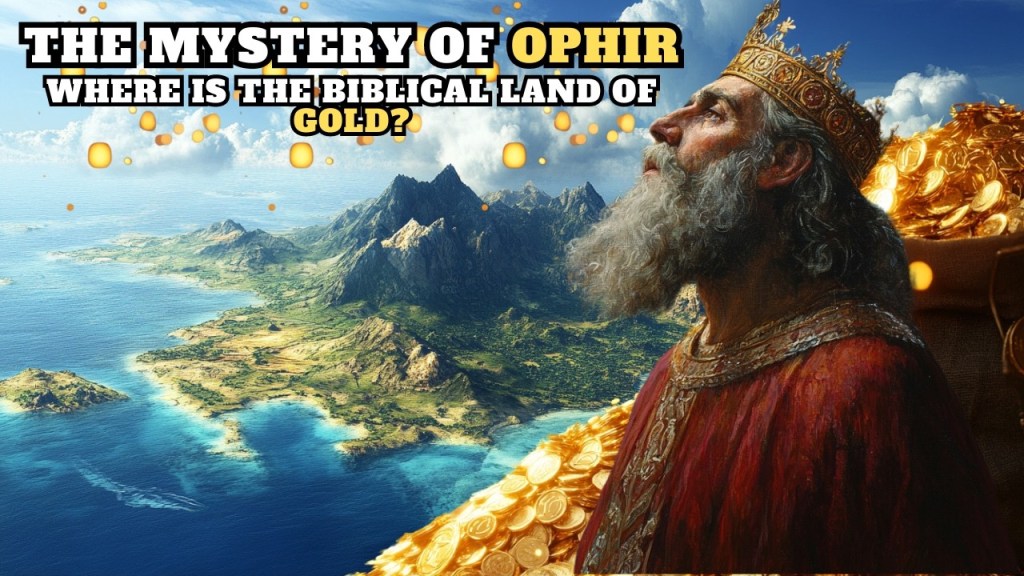
Ophir is mentioned in a number of verses throughout the Old Testament and always in context of its gold and mineral wealth. One would expect this nation to standout amongst Joktan’s descendants today, just by sheer size of either resources and or, its economy.
The meaning of Ophir is contradictory as it can mean, ‘exhausted, depleted’ and ‘reducing to ashes’ – ‘which is what remains when all useful energy is extracted from a fuel’ – or conversely: ‘rich, abundance’ a ‘mark of wealth’ or a ‘coast of riches’ according to Abarim Publications.
Glenn Webb – emphasis & bold mine:
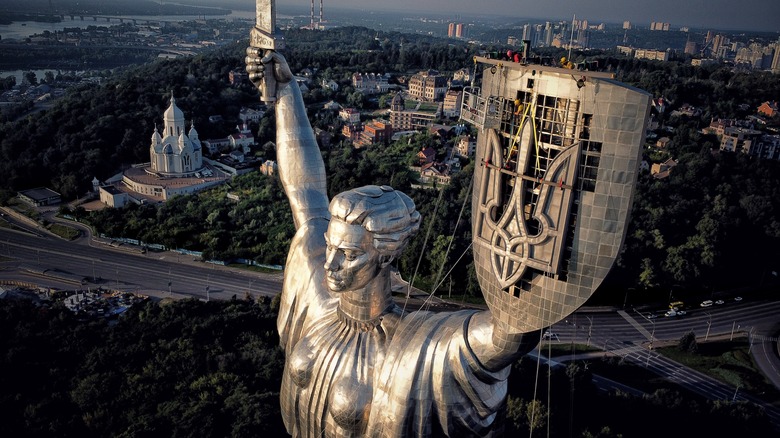
‘Excerpt from Peresopnytsia Gospel (Matthew 19:1) (1556) where the word ukrainy (оукраины) corresponds to ‘coasts’ (KJV Bible) or ‘region’ (NIV Bible). [The] Ukrainian symbol is a trident and has a coastline to its south.’
Ukraine is Ophir, the eleventh son of Joktan.
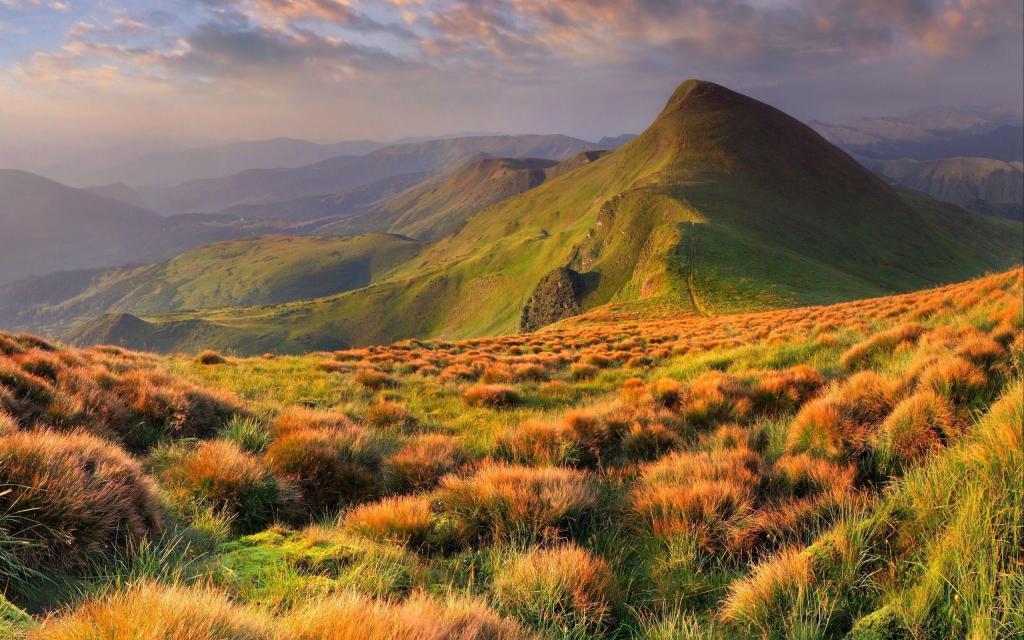
Carpathian Mountains
Ophir is not the Philippines or located in Saudi Arabia as some teach. All the conflicting definitions for Ophir’s name are strangely specific and accurate about Ukraine and parallel the rather schizophrenic history and destiny of Ukraine as an unhappy and unwilling junior partner of Russia. The verb even means ‘to desire or draw near’ exactly typifying the relationship which Little Russia has with Great Russia.
For the largest Russian diaspora in the world are the 8,334,100 Russian people living in Ukraine (2001 Census). To complicate matters, a third of the Ukrainian population in the eastern part of the country identify as Russian, speaking Russian. Other Ukrainians also speak Russian and higher percentages of Russians live in the western and central regions of the nation, as well as in the industrialised city centres.

The total population of Ukraine is 39,717,982 people – marginally higher than Poland and the seventh highest in Europe.
Rare Gold Nuggets – emphasis mine:
‘Gold mining is still a young and growing industry in Ukraine. As with many regions in the world with a turbulent political history, the economic development in the mining industry has been limited… Ukraine holds large reserves of gold in several regions… some suggestions that there is as much as 3,000 tons of gold to be found all around Ukraine…’
This is the equivalent of 2,722 tonnes and would place Ukraine 5th in countries with the largest gold mine reserves, behind Australia at number one with 10,000 tonnes; Russia with 5,300 tonnes; South Africa with 3,200 tonnes; and the United States with 3,000 tonnes.
The value of 2,722 tonnes of gold is a staggering USD $209,005,228,637.00.
‘… there are more than two hundred locations around Ukraine that gold is known to be found. The potential for gold… is amazingly vast… These are huge expectations for a huge country.’
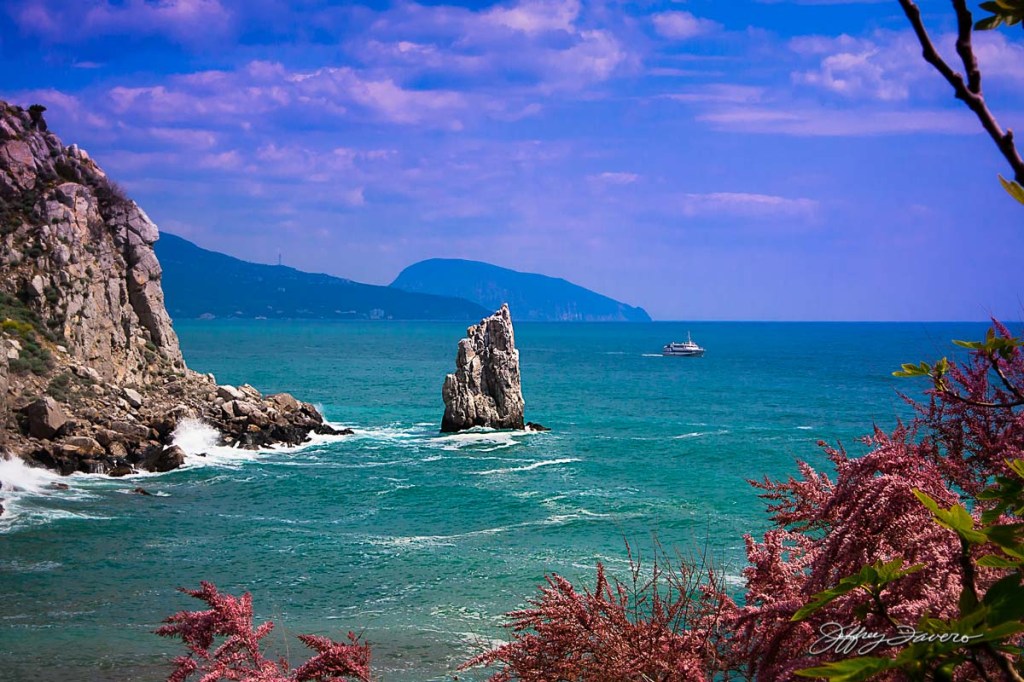
Black Sea
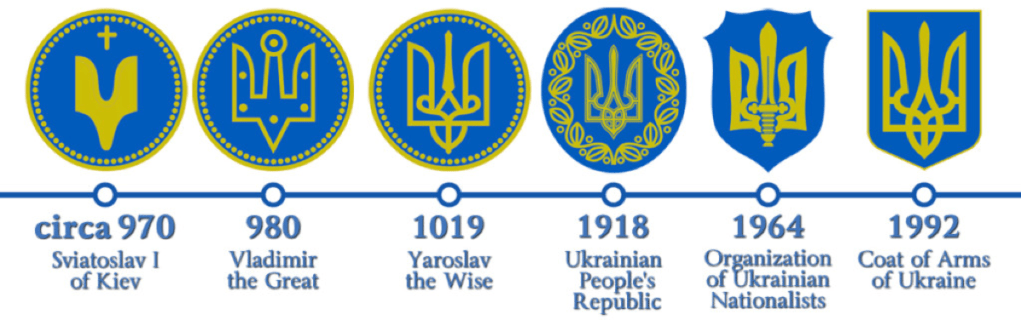
A Short History of the Ukrainian Tryzub, Gary Sohayda, January 2022 – emphasis mine:
‘A trident with a crossed central prong was… confirmed in 1918 as the emblem of the Ukrainian Black Sea Fleet. In 1939, the Diet of Carpatho-Ukraine, the short-lived independent Ukrainian state that emerged from Czecho-Slovakia, adopted the trident with a cross as its official coat of arms. Finally, in 1992, following the restoration of Ukraine’s independence the previous year, Ukraine’s Parliament adopted the trident as the chief element in its coat of arms.
The trident is today shown on Ukraine’s monetary emissions (coins as well as some bank notes or their watermark) and on its postage stamps.’
The Trident is a potent symbol of the god of the sea and water, Neptune and Poseidon. A link to Ophir’s strategic importance for gold via its position in ancient mercantile trade routes – once located in Sumer near the Persian Gulf, then later during the United Kingdom of Israel and the reign of King Solomon, on the southern coast of the Arabian Peninsula. Today, Ukraine represents a vital ‘warm water port’ for itself and Russia and hence, the obvious importance of the Crimea.

The trident is a weapon, whether for spear fishing or as a pole arm. The significance as a weapon of Neptune is the fact that it symbolises his control over the seas. Though its wider application is that the three prongs reflect his mastery over the three principalities of heaven, earth and hell. Neptune’s power does not stop there, for it is also linked with birth, life and death; mind, body and spirit; and the past, present and future – Article: DEATH: A Dead End or a New beginning?
Odessa, is a major city (third most populous with a million people) and important seaport in southwestern Ukraine, located on the northwestern shore of the Black Sea. It is known for its rich history, diverse culture and significant economic role as a transport hub.
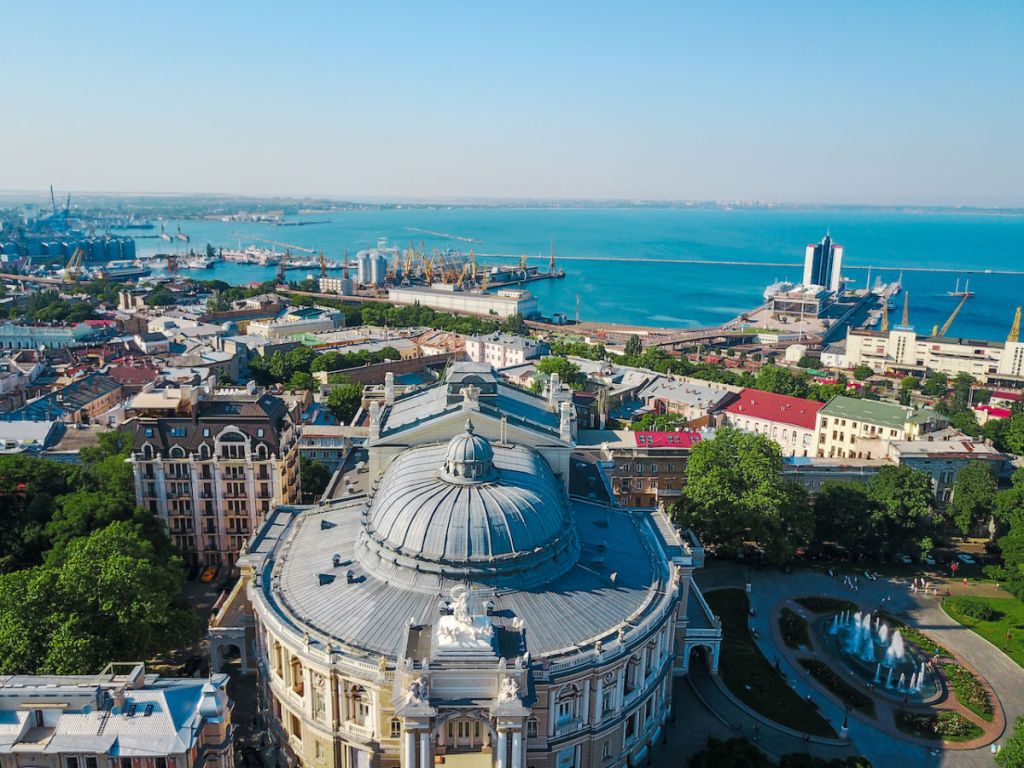
Odessa (also spelled Odesa) is home to several key ports, including the Port of Odesa and Port Pivdennyi, which are vital for Ukraine’s trade.
Ukraine is the 4th biggest mineral producer in the world, behind South Africa in first place, Russia and Australia. Ukraine has up to $510 billion in iron ore reserves alone. Apart from the presence of many mineral reserves, Ukraine is best known for its productive mining sector. There are over three hundred mining facilities actively operating across Ukraine.
As an aside, both South Africa and Australia were foreordained to be rich in natural resources and consequently mineral powers – Chapter XXXII Issachar, Zebulun, Asher & Naphtali –the Antipodean Tribes.

Ukrainian man and woman

Europe’s second largest country, is a land of vast fertile agricultural plains and large pockets of heavy industry in the east. Ukraine is known as the ‘breadbasket’ of Europe and is amongst the top three exporters of grain in the world. It has some of the most fertile land on earth with rich black soil called chernozem – literally, ‘black dirt.’
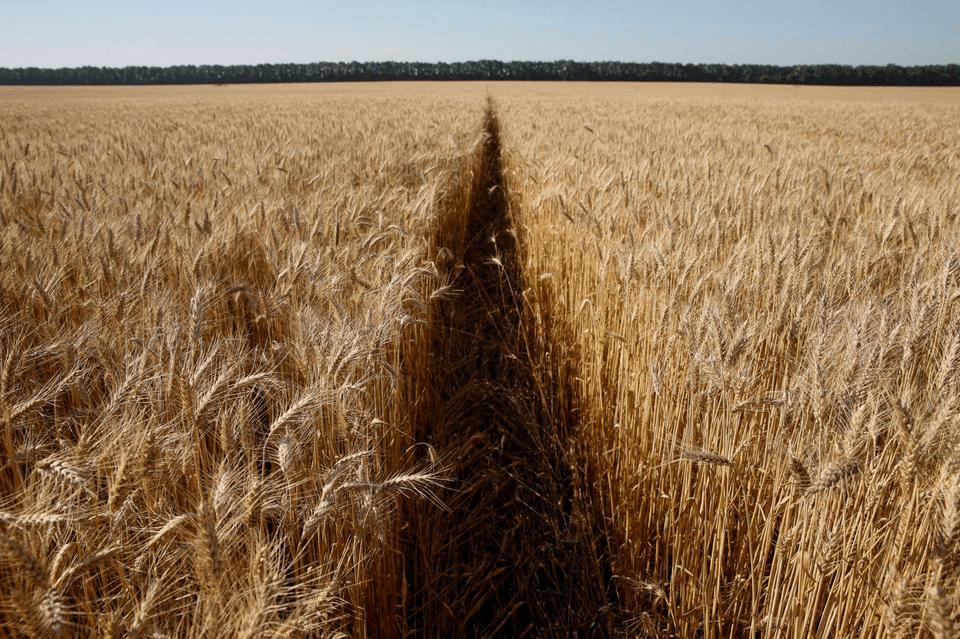
This soil produces considerable agricultural yields due to its high moisture storage capacity and levels of humus; with more than seventy percent of the country comprising prime agricultural land. Parts of Russia and the United States of America also have rich soils with high organic content called mollisols.
It is estimated that Ukraine can feed at least half a billion people. Its main crops include:
corn, soybeans, rye, oats, beets and barley.
With Russia, Ukraine supplies a quarter of the world’s wheat and half of its sunflower products. Ukraine is the fourth largest producer of potatoes in the world.
Ukraine had the 57th largest economy in the world with a GDP of $191 Billion in 2024.
In 2026, Ukraine made up 0.17% of the world’s economy, compared to 0.37% in 1987.
‘The following export product groups represent the highest dollar value in Ukrainian global shipments during 2024.
- Cereals: US$9.4 billion (23.3% of total exports)
- Animal/vegetable fats, oils, waxes: $5.8 billion (14.2%)
- Oil seeds: $3.4 billion (8.3%)
- Iron, steel: $3.1 billion (7.7%)
- Ores, slag, ash: $2.9 billion (7.3%)
- Electrical machinery, equipment: $1.54 billion (3.8%)
- Food industry waste, animal fodder: $1.48 billion (3.7%)
- Wood: $1.44 billion (3.6%)
- Meat: $1.1 billion (2.6%)
- Articles of iron or steel: $944.3 million (2.3%)
Ores, slag and ash was the fastest grower among the top 10 export categories, up by 57.3% from 2023 to 2024. In second place for improving export sales were oil seeds via a 19.2% advance. Ukraine’s shipments of meat posted the third-fastest gain in value, up by 18%. The leading decliner among Ukraine’s top 10 export categories was electrical machinery and equipment, recording a -7.6% year-over-year drop.’
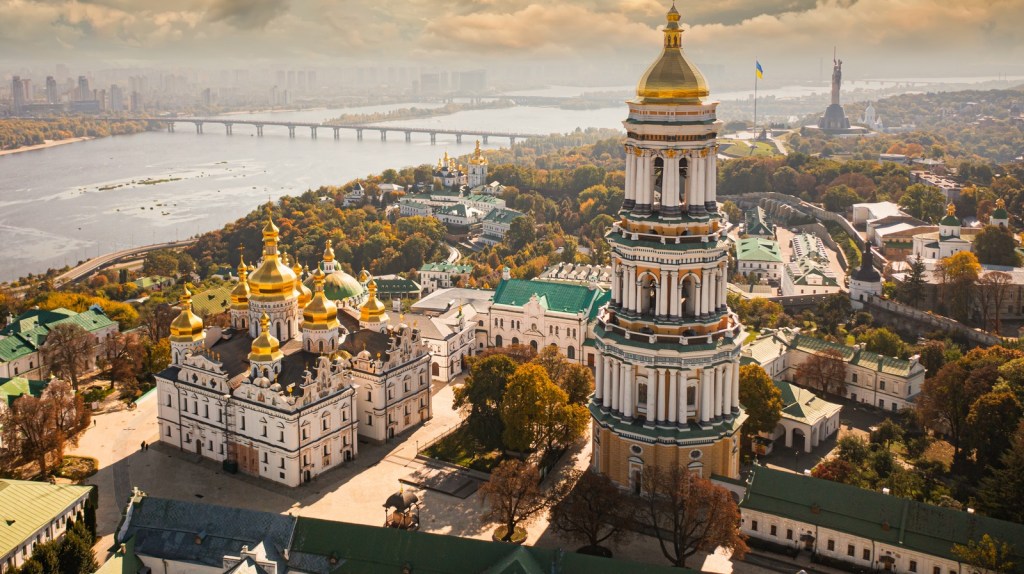
Kiev the capital of Ukraine
The word Ukraine literally means, on the outskirts and from a Russian imperial perspective, that has been true. Ukraine has been ‘the borderland’ for much of its existence, enduring its role as a convergence point between the East and the West; partly including territory once occupied by the Scythian and Sarmatian peoples. Ukraine and Russia share common historical origins, especially in the East; whereas the west of the country has closer ties with its European neighbours and particularly Poland.

Early Germanic tribes from Jutland and surrounding environs migrated and in time some of them would filter down towards western Ukraine, including the mighty Goths who would control a vast swathe of Ukraine for a couple of centuries. Following this, Ukraine was home to some of the earliest Slav states – descendants of the earlier Sarmatians – and notably, the grand principality of Kiev in the tenth and eleventh centuries made it a focus of East Slavic cultural development.

The Cossack Hetmanate republic emerged in central Ukraine in the seventeenth century. The region only gained more permanent borders during the Soviet era and independence as a sovereign nation wasn’t achieved until 1991, upon the collapse of the Soviet Union.
Ukraine is a unitary republic governed under a semi-presidential system which has been moving increasingly towards strengthening ties with the rest of Europe, until the 2022 invasion by Russia.
Ukraine’s military is ranked 20th (marginally higher than Poland) out of 145 countries in the Global Firepower index for 2026.
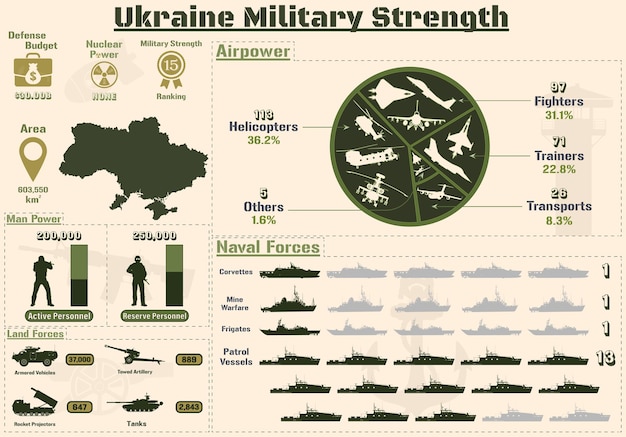
Ukraine has approximately one million personnel actively defending against Russian aggression.
In the process, Ukrainian Armed Forces have evolved significantly, becoming Europe’s largest and most effective fighting force, supported by a growing domestic military-industrial complex.
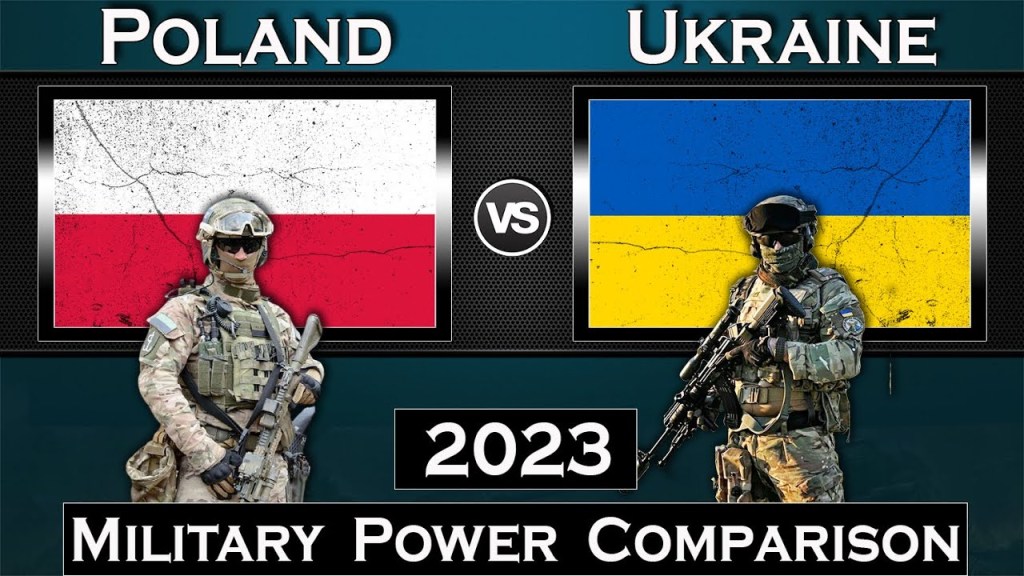
Comparing military match-ups between nations is interesting, though a comparison between Poland and Ukraine’s capabilities is fascinating in that they are equally matched in the full sense of the word.
Yet this is only a recent (and temporary) occurrence as Poland seeks to increasingly invest in expanding its military arsenal, due to the vicissitudes of its eastern neighbour Ukraine – pivotal buffer against Russia – as well as its ongoing commitment to NATO.
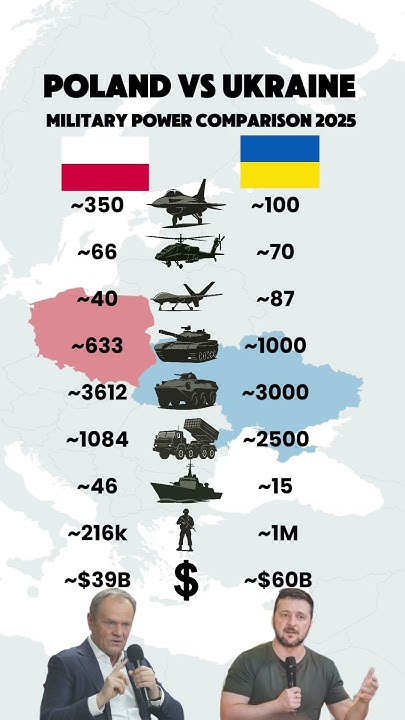
Poland possesses a bigger and stronger economy than Ukraine presently and so while Ukraine has a marginally more powerful military; Poland will surely surpass Ukraine in military strength, with its higher expenditure enabling Poland to maintain this new status quo for the long term.
Ukrainian Flag
Referring to the modern state as The Ukraine is incorrect both grammatically and politically, says ‘Oksana Kyzyma of the embassy of Ukraine in London. “Ukraine is both the conventional short and long name of the country.” The use of the article relates to the time before independence in 1991, when Ukraine was a republic of the Soviet Union. After the collapse of the Soviet Union, Ukrainians probably decided that the article denigrated their country (by identifying it as part of Russia) and abolished ‘the’ while speaking English… As well as being a form of linguistic independence in Europe, it is also hugely symbolic for Ukrainians.’
Ukraine Is the Most Important Country for the European Union… Ivan Dikov, 2019:
‘Which is the most important “outside” country for the European Union at the present moment and for the foreseeable future… It’s Ukraine. The reason… Ukraine is the largest country that has the realistic potential, the desire, and a wide range of prerequisites to become a member state of the European Union… Of course, that is a very long shot: Ukraine hasn’t even been recognized as an official EU candidate country yet, and it’s not even sure when it will be, or even that it ever will be… [yet it’s] population seemingly has the desire to do so, and, what’s ever more important, whose society wishes to change correspondingly in the process.
… Ukraine is what Poland was among the countries that joined the EU in the three “Eastern Enlargements” in the decade between 2004 and 2013… the great thing about the European Union is that it is a Union of “losers”: countries which either built empires to see them crashing down, or which were otherwise crushed, mauled, or severely threatened by empires… Ukraine… is quite big but not too big, so that… the Union as a whole… will be able to “swallow” its accession with relative ease.
If or when Ukraine becomes a member of the EU, it would naturally assume a spot among the Big Six – which are now about to become the Big Five… (Germany, France, Italy, Spain, Poland)… while this is still a very long shot, and Britain’s departure (which itself was a long shot for a while) is regrettable, but such a set up would bring a better East – West balance inside the EU… It would be very shrewd of the entire European Union to take notice of that fact.’
Any movement by Ukraine towards the European Union have been stopped in its tracks at time of writing; with Russian forces entering the Ukraine on February 24, 2022, with a build up of Russian troops in the Crimea beginning on the formidable date of 22.02.2022.
Events today were created centuries ago.
Between 1772 and 1795, the Russian Empire and Hapsburg Austria as a result of the Partitions of Poland each had control of the territory which comprises modern day Ukraine for a hundred years or more. The Russian Revolution led to the Ukraine’s own civil war and then war with the Soviet Union from 1917 to 1921. In 1922, one hundred years ago, the Ukrainian Soviet Socialist Republic was established. Leap ahead to 1954 and new Soviet leader Khrushchev who succeeded Stalin; himself a Ukrainian, transferred Crimea to Ukraine to mark the 300th anniversary of the Russian-Ukraine Union. When the Soviet Union dissolved in 1991, Crimea became independent.
Late 2013 President Viktor Yanukovych, suspended preparations for the implementation of an association agreement with the European Union. This decision resulted in months of mass protests. The Ukrainian parliament impeached Yanukovych on 22 February 2014. During the 22nd and 23rd February – exactly eight years previously – the Russo-Ukrainian War began with Russian forces entering Crimea. It was not an invasion as such since Russia had a naval base in Sevastopol. A referendum in the largely ethnic Russian autonomous region of Crimea was held and with a ninety-five percent majority mandate, Crimea was de facto annexed by Russia in March 2014.
The Crimean Peninsula has key strategic importance as the Black Sea region is pivotal to Russia, for it is the only gateway to the Mediterranean, Africa and beyond. Access is vital for shipping, oil and gas pipelines, as well as for military operations. Russia could and would, never give up this most important warm water sea gate.

It was during the Crimean War between 1853 to 1856 that a coalition comprising Britain, France and Turkey won Crimea from Russia. Russia’s mistrust of the West is reasonable and the threat of Ukraine joining the European Union and or Nato with possible foreign military presence on Russia’s border, led to its preemptive strike on Ukraine, to topple a puppet regime with links to and support from, the West.
Ukraine is very unstable with its ‘debt-to-GDP ratio [doubling] and close to 60% of the people [living] below the poverty line. Its industries are crumbling, and pensions/social welfare have been deeply slashed. Neo-Nazi groups are on the rise, and 80% of young people are desperate to leave the country’ now with no end in sight.
And so like its name Ophir, Ukraine is at once a nation ‘exhausted, depleted’ and is being ‘[reduced] to ashes’ – yet remains a nation potentially ‘rich, [with] abundance’ having a ‘mark of wealth’ and a ‘coast of riches.’
One nation we have not discussed, whom enigmatically may or may not descend from Joktan, is Finland – refer Chapter XXVII Abraham & Keturah – Benelux & Scandinavia.
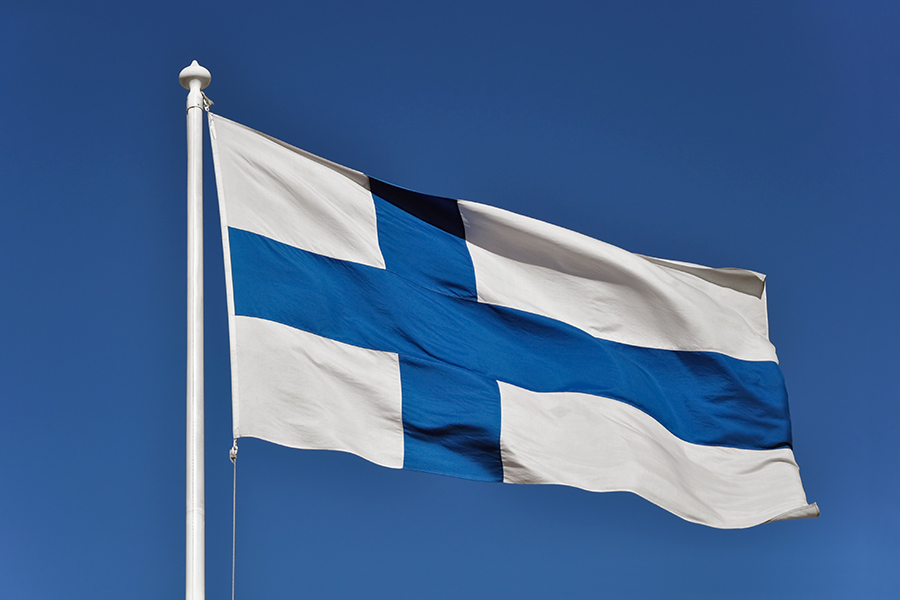
Flag of Finland
We will investigate the Finns further, though will include them with Joktan for the time being, for they still share a common descent from Arphaxad. Finland is ranked number 10 in the top ten technologically advanced nations, one behind China at nine. According to the Global Innovation Index, Finland ranks number six in the world. Recall Singapore is number five and South Korea tenth in the world.
Finland is famously renowned as the creator of Nokia which ‘ruled the communication industry, for over a dozen years.’ Finland is proficient in high-tech projects and exhibits medical prowess. Finland’s core areas of focus are in biosciences, energy and environmental sciences.

Finnish man and woman

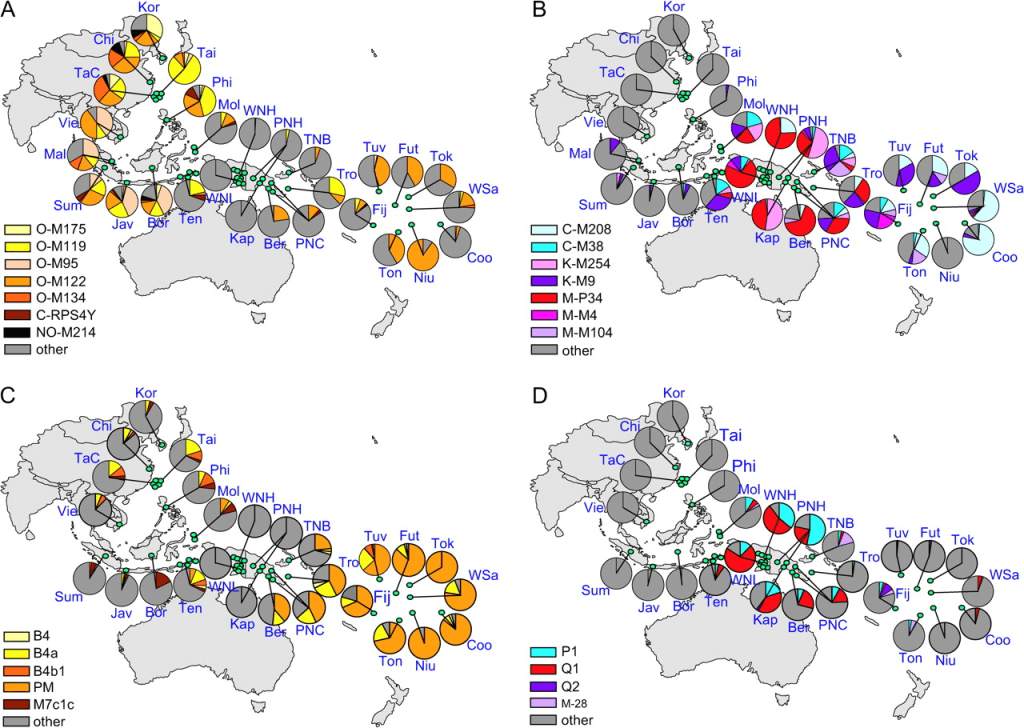
The division between Eber’s sons Joktan and Peleg is supported not just by geography, language and culture but chiefly, genetically.
A major Haplogroup of the paternal Y-chromosome tree is the extensive R1, which is represented by two principle lineages: R1a and R1b.
More than half the men of European descent belong to R1b.
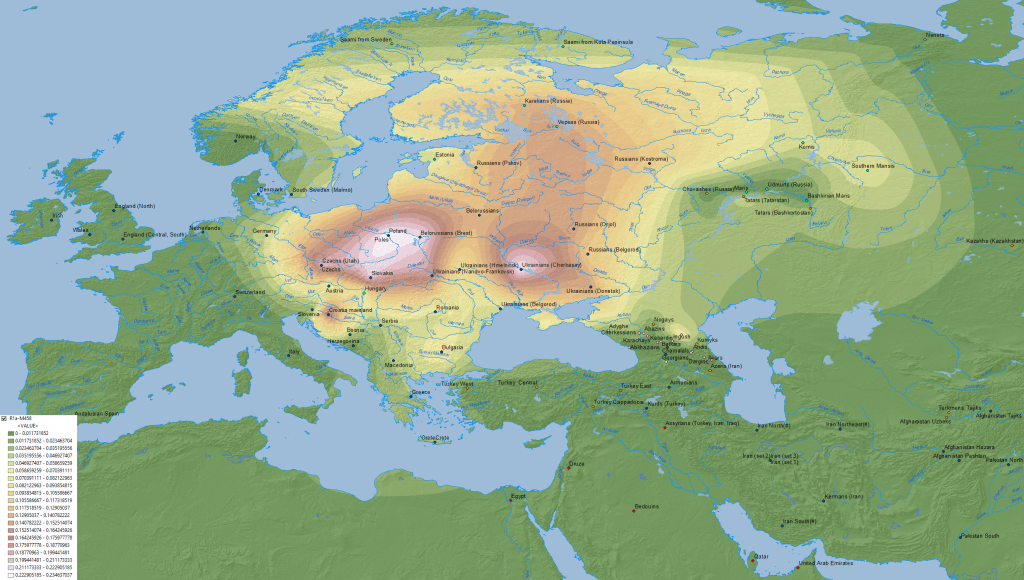
Haplogroup R1a-Z93, is primarily found in central Asia, southern Asia (both through admixture) and as a defining marker Haplogroup of the Slavic speaking male populations in Eastern Europe – Z283.

The Y-DNA map of West Eurasia shows the principle Haplogroup division for Europe into, not just a north-south or east-west split but into quarters.
Thus for north western Europe the predominant Haplogroups include I1 (and N1c1 from Japheth admixture); for western Europe, R1b (and I2a2); for eastern Europe R1a; and for south eastern Europe, I2a1.
What is important to stress is to understand that the defining Y-DNA marker Haplogroup for Joktan’s male descendants is R1a (Z282, Z280).
Haplogroup I2a1 though frequent in the Balkan region, is an older lineage and those men who carry I2a1 are distantly related but not the same as the males with R1a – refer article: Y-DNA Adam & mtDNA Eve: The Genesis and Evolution of Homo sapiens.
Similarly, the Balkan men who carry J2, J1 and E1b1b lineages are reflecting mutations from a Hamitic (or Canaanite) line of descent such as from Phut, Mizra and Canaan respectively.
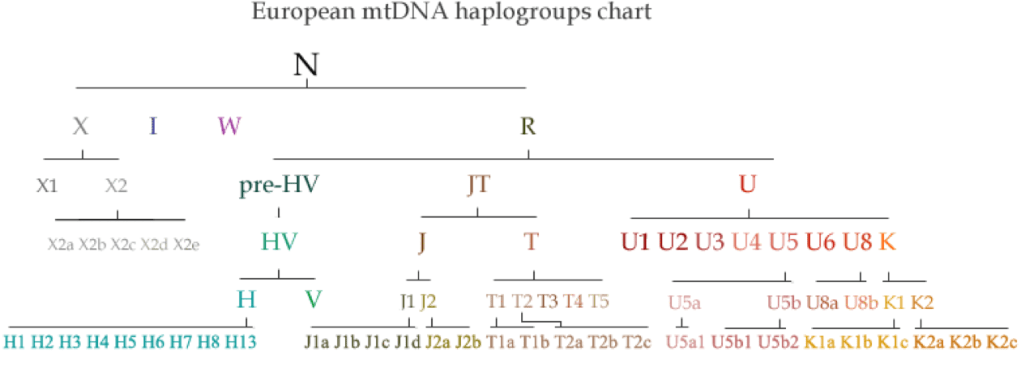
Below, are listed the leading mtDNA maternal Haplogroups – showing the diversity yet interconnectedness of the peoples of eastern Europe descending from Joktan’s thirteen sons, at least – stretching from Finland in the North to Greece in the South. Data for Moldova, Montenegro and Kosovo not included.
Following, is a comparison of the four principle nations outlined from the scriptures, plus Finland, as well as the other nations of eastern Europe in approximate geographical order, descending from the northwest to the southeast.
Finland: H [36.3%] – U5 [20.7] – W [9.6%] – HV0+V [7.3%] –
J [5.9%] – K [4.5%] – I [4.2%] – T2 [2.4%]
Ukraine: H [39%] – U5 [9.8%] – T2 [8.4%] – J [8.1%] –
U4 [5.8%] – K [4.9%] – HV0+V [4.3%] – HV [3.5%]
Poland: H [43.9%] – U5 [10.1%] – J [7.9%] – T2 [6.9%] –
U4 [5.2%] – HV0+V [4.9%] – K [4%] – W [3.6%]
Romania: H [37.2%] – J [10.5%] – K [7.9%] – U5 [7.2%] –
T2 [5.1%] – HV0+V [4%] – W [3.9%] – T1 [3.5%]
Greece: H [40.5%] – J [9.5%] – T2 [6.6%] – U5 [5.2%] – K [5.1%] –
X [4.2%] – U3 [3.8%] – T1 [3.5%] – HV [2.7%]
Estonia: H [45.8%] – J [10.7%] – T2 [7.6%] –
U5 [ 13.3%] – U4 [5.7%] – W [3%]
Latvia: H [42%] – U5 [10%] – U4 [8.7%] –
T2 [6.3%] – J [6%] – I [4.6%]
Lithuania: H [45.3%] – U5 [11.4%] – T2 [7%] –
J 6.4%] – U4 [3.8%]
Belarus: H [39.1%] – U5 [9.1%] – J [8.9%] –
U [6.6%] – HV0+V [6%] – T2 [5.1%]
Czech R: H [40.2%] – J [10%] – U5 [9.7%] –
T2 [7.7%] – T1 [4%] – K [3.4%]
Slovakia: H [43%] – U5 [ 11.1%] – J [9.6%] –
T2 [8.1%] – U4 [5.5%] – K [3.8%]
Hungary: H [39.2%] – J [10.1%] – T2 [8.7%] –
U5 [7.4%] – K [6.8%] – W [5.2%]
Slovenia: H [44.4%] – J [9.8%] – U5 [9%] –
T2 [6.4%] – K [5.3%] – HV0+V [4.8%]
Croatia: H [41.1%] – U5 [10.3%] – J [9.7%] –
T2 [5.8%] – HV0+V [5.1%] – K [5.1%]
Serbia: H [41%] – U5 [9.4%] – J [6.8%] – U4 [6.8%] –
HV0+V [5.1%] – K [4.3%]
Bosnia/H: H [45.8%] – U5 [8.8%] – J [8.3%] –
U4 [4.9%] – K [4.9%] – HV0+V [4.7%]
Macedonia: H [45%] – U5 [8%] – J [7.5%] –
K [5%] – HV0+V [4.5%] – T1 [4.5%]
Bulgaria: H [41.9%] – J [7.7%] – U5 [6.9%] –
K [5.8%] – T2 [4.7%] – T1 [4.7%]
Albania: H [47.9%] – J [7.1%] – U5 [6.4%] –
T2 [5.5%] – K [5.2%] – T1 [4.3%]
Placing the data in a relative geographic order does not show specific relatedness; though PCA graphs do confirm the geographic clusters as being indicative of who is most closely related to whom in eastern Europe.
The Finns are unique, yet in turn are the most related to the Baltic nations, who are then related to the Poles, Belorussians and Ukrainians – and by extension, the Russians.
The Czechs and Slovaks are next genetically related with a gap between them and the Slovenians, Hungarians, Croats and Moldavians.
Further in genetic distance are the Serbians and Bosnians and then Romanians, Bulgarians and Macedonians.
Unsurprisingly, the most distantly related from the Finns, are the Albanians and Greeks. Finland stands out as an outlier; even so, they are not related to Scandinavia – comprising Sweden, Denmark and Norway – even though counted a Nordic nation like Iceland.
H HVO+V J T2 U4 U5 K W
Finland 36 7 6 2 1 21 5 10
Romania 37 4 11 5 3 7 8 4
Belarus 39 6 9 5 3 9 2 4
Ukraine 39 4 8 8 6 10 5 3
Hungary 39 5 10 9 3 7 7 5
Czech R. 40 3 10 8 2 10 3 1
Croatia 41 5 10 6 2 10 5 3
Serbia 41 5 7 2 7 9 4 3
Greece 41 2 10 7 3 6 5 1
Latvia 42 3 6 6 9 10 2 4
Bulgaria 42 4 8 5 4 7 6 3
Slovakia 43 3 10 8 6 11 4 2
Poland 44 5 8 7 5 10 4 4
Slovenia 44 5 10 6 3 9 5 2
Lithuania 45 5 6 7 4 11 2 2
Macedonia 45 5 8 4 2 8 5 4
Estonia 46 2 11 8 6 13 2 3
Bosnia & H. 46 5 8 4 5 9 5 3
Albania 48 3 7 6 3 6 5 3
Haplogroup H is the most frequent mtDNA found in Europe and based on an ascending percentage for this Haplogroup, places Finland as one bookend, with the lowest percentage and Albania as the other, with the highest. Not a big surprise, yet what is, is the fact that the groupings do not match geographic location or the PCA relationships.
Finland stands out with its disproportionately high levels of U5 and W. The Baltic nations also possess relatively higher percentages for Haplogroup U5.
Spain: H [44.1%] – J [6.6%] – T2 [6.4%] – K [6.3%] –
U [1.8%] – HV [0.7%]
Ukraine: H 39%] – J [8.1] – K [4.9%] – HV [3.5%] –
T2 [2.4%] – U [0.6%]
Russia: H [41.2%] – J [7.8%] – T2 [6.5%] – K [3.7%] –
U [2.2%] – HV [1.8%]
Turkey: H [30.8%] – J [8.9%] – U [6.3%] – K [5.6%] –
HV [4.8%] – T2 [4.3%]
Iran: H [16.9%] – J [13.8%] – U [11.8%] – HV [7.4%] –
K [7.3%] – T2 [4.9%]
As one heads west, the most prevalent Western Eurasian mtDNA Haplogroup H, essentially increases in the prominent nations descended from Shem, studied to date. Haplogroup T2 also increases, whereas Haplogroups J, U and HV decrease. In contrast with younger Haplogroup T, Haplogroup U is one of the oldest and most diverse of the European Haplogroups.
H HV HV0+V J T2 U U5 K
Brazil 44 2 11
Portugal 44 0.1 5 7 6 3 7 6
Spain 44 0.7 8 7 6 2 8 6
Poland 44 1 5 8 7 1.4 10 4
Russia 41 2 4 8 7 2 10 4
Greece 41 3 1.8 10 7 3 5 5
Ukraine 39 4 4 8 8 0.6 10 5
Romania 37 2 4 11 5 2 7 8
Finland 36 7 6 2 0.8 21 5
Turkey 31 5 0.7 9 4 6 3 6
Iran 17 7 0.6 14 5 12 3 7
With the exception of Poland, the descendants of Joktan are entirely sandwiched between Asshur at one end and Elam and Lud on the other.
A few of Arphaxad’s children from Joktan have much in common with the Russians when comparing mtDNA Haplogroups. With the six already highlighted, the additional five nations reflect the changing Haplogroups from north to south and east to west. Supporting the contention that the descendants from Arphaxad’s great grandson Joktan, share strong similarity with one of their four uncles. Their offspring equate to cousins.
There is no denying that northern Europe, as represented by Poland and Ukraine for instance, are strikingly similar with the Russians. A shared maternal ancestor at some point is feasible for the Russians, Ukrainians and Belorussians.

Eupedia – emphasis & bold mine:
‘99% [of Y-DNA Haplogroup] R1a people belong to subclades of R1a1a1 (R1a-M417), which is divided in the following subclades:
R1a-Z645 makes up the majority of R1a individuals from Central Europe to South Asia.
R1a-Z283 [R1a1a1b1] is the main Central & East European branch.
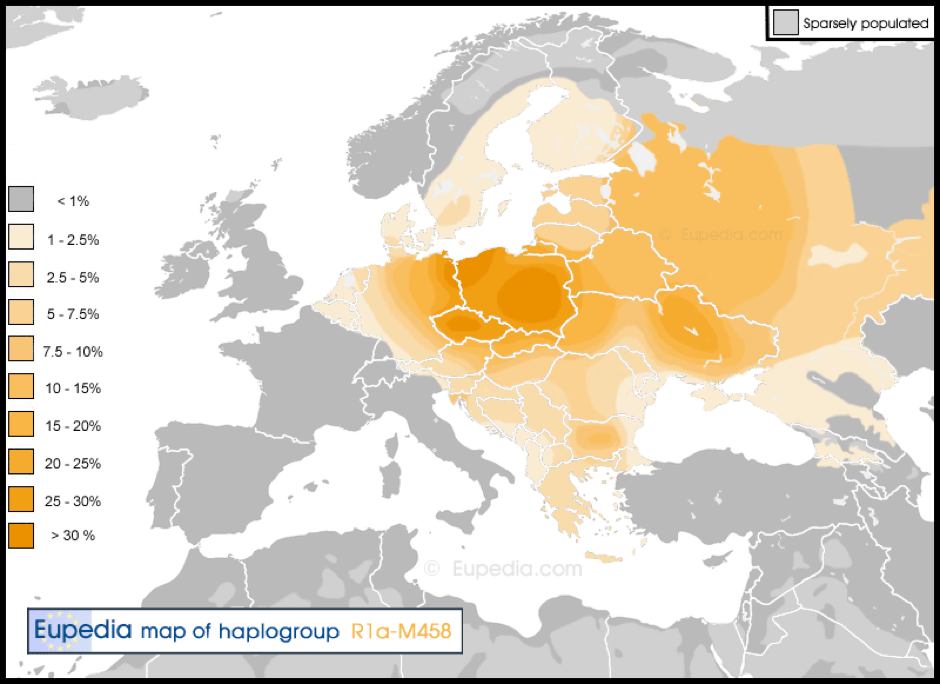
R1a-M458 [R1a1a1b1a1], primarily a [western] Slavic subclade, with maximum frequencies in Poland, the Czech Republic, Slovakia, but is also fairly common in southeast Ukraine and northwest Russia.
Its subclade R1a-L260 [R1a1a1b1a1a] is clearly West Slavic, with a peak of frequency in Poland, the Czech Republic and Slovakia, and radiating at lower frequencies into East Germany, East Austria, Slovenia and Hungary.’
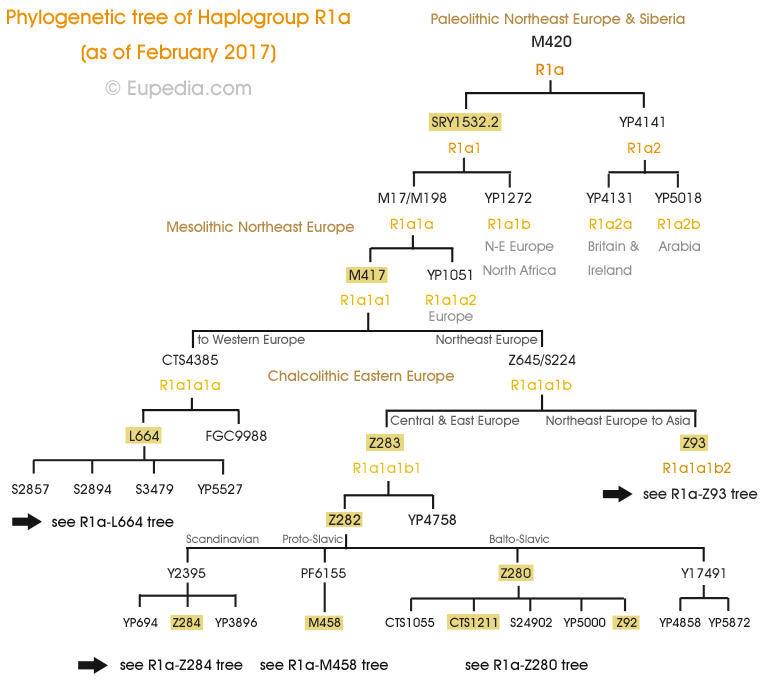
‘R1a-Z280 [R1a1a1b1a2] is also an Balto-Slavic marker, found all over central and Eastern Europe (except in the Balkans), with a western limit running from East Germany to Switzerland and Northeast Italy. It can be divided in many clusters: East Slavic, Baltic, Pomeranian, Polish, Carpathian, East-Alpine, Czechoslovak, and so on. Its subclade R1a-L365 is a Pomeranian cluster found also in southern Poland.’
‘In terms of observable haplogroups, Greece and Albania are quite alike. Although geographically close to Sweden and Norway, Finland looks genetically very different, having more similarities with places like Estonia and Lithuania.
Bulgaria and Romania are extraordinarily similar to one another. The haplogroup compositions of the Czech Republic, Austria, and Hungary aren’t exactly identical, but very comparable.
Greece‘s genetic makeup has a lot in common with Turkey’s. Genetically speaking, Latvia, Lithuania, and Estonia are extremely similar.
The Balkans is likely the most genetically varied area of Europe. Haplogroup N3 [N1] is observable all over Eastern Europe, but it’s practically nonexistent in Western Europe. Haplogroup R1a is one of the most predominant haplogroups in Nordic regions [Z284] and Eastern Europe [Z282]. While in Western Europe the most prevalent haplogroup is clearly R1b.
The farther north you go in Europe, the harder it is to detect Haplogroup J1(Jewish, Arabic). There is now strong evidence that both R1a and R1b people contributed to the diffusion of the A111T mutation of the SLC24A5, which explains approximately 35% of skin tone difference between Europeans and Africans, and most variations within South Asia’ – refer Chapter XVI Shem Occidentalis.
‘The distribution pattern of the A111T allele (rs1426654) of matches almost perfectly the spread of Indo-European R1a and R1b lineages around Europe [derived from Shem], the Middle East [from Shem through admixture^], Central Asia^ and South Asia^.
R1a populations have an equally high incidence of this allele as R1b populations. On the other hand, the A111T mutation was absent from the 24,000[?] -year-old R* sample from Siberia, and is absent from most modern R2 populations^ in Southeast India and Southeast Asia. Consequently, it can be safely assumed that the mutation arose among the R1* lineage during the late Upper Paleolithic, probably some time between 20,000 and 13,000 years ago [or more likely between circa 8000 to 7000 BCE according to an unconventional chronology].
… the genes for blue eyes were already present among… Europeans belonging to Y-haplogroup I.
The genes for blond hair are more strongly correlated with the distribution of haplogroup R1a, but those for red hair have not been found in Western or Central Europe before the Bronze Age [beginning circa 2500 to 2000 BCE], and appear to have been spread primarily by R1b people.
Nowadays, high frequencies of R1a are found in Poland (57.5% of the population), Ukraine (40 to 65%), European Russia (45 to 65%), Belarus (51%), Slovakia (42%), Latvia (40%), Lithuania (38%), the Czech Republic (34%), Hungary (32%), Norway (27%), Austria (26%), Croatia (24%), north-east Germany (24%) Sweden (19%), and Romania (18%).’

‘Haplogroup N1c is found chiefly in north-eastern Europe, particularly in Finland (61%), Lapland (53%), Estonia (34%), Latvia (38%), Lithuania (42%) and northern Russia (30%), and to a lower extent also in central Russia (15%), Belarus (10%), eastern Ukraine (9%), Sweden (7%), Poland (4%) and Turkey (4%).
N1c represents the western extent of haplogroup N, which is found all over the Far East (China, Korea, Japan), Mongolia and Siberia, especially among Uralic speakers of northern Siberia.
Haplogroup I1 is the most common type of haplogroup I in northern Europe. It is found mostly in Scandinavia and Finland, where it typically [represents] over 35% of the Y chromosomes. Associated with the Norse ethnicity, I1 is found in all places invaded by ancient Germanic tribes and the Vikings.
After the core of ancient Germanic civilisation in Scandinavia, the highest frequencies of I1 are observed in other Germanic-speaking regions, such as Germany, Austria, the Low Countries, England and the Scottish Lowlands, which all have between 10% and 20% of I1 lineages.
Haplogroup I2 is the most common paternal lineage in former Yugoslavia, Romania, Bulgaria and Sardinia, and a major lineage in most Slavic countries. Its maximum frequencies are observed in Bosnia (55%, including 71% in Bosnian Croats), Sardinia (39.5%), Croatia (38%), Serbia (33%), Montenegro (31%), Romania (28%), Moldova (24%), Macedonia (24%), Slovenia (22%), Bulgaria (22%), Belarus (18.5%), Hungary (18%), Slovakia (17.5%), Ukraine (13.5%), and Albania (13.5%). It is found at a frequency of 5 to 10% in Germanic countries.’

The principal Y-DNA Haplogroups for Eastern Europe fall into five major categories which are either N1c1, R1a, I2a1, E1b1b or J2.
Haplogroup N through admixture is indicative of northern inhabitants; similarly for E1b1b and J2 in southern Europe; with R1a and I2a1 sitting in-between them on an east-west axis.
Higher percentages of the N1c1 group are found mainly in the Balts and the same for the I1 group which is found mainly in the northern Slavs. The I2a1 and E1b1b groups are predominantly associated with southern Slavs and J2 in Greece.
Levels of R1a are typically stronger in western Slavs. As far as a neat split thirteen ways to indicate the thirteen sons of Joktan, the data could be manipulated a number of ways for the desired outcome. Remember too, that of these paternal Haplogroups, only R1a, I1 and I2a1 descend from Shem and it is R1a which is the defining marker Haplogroup for males in Eastern Europe (and Russia).
While I2a1 is an older ancestral line related to – though clearly prior to – R1a mutations.

What is interesting is that if one takes a Cold War map of Europe prior to 1991, there were thirteen nations exactly in Eastern Europe.
With the exception of Finland, one which was not part of the Soviet Union, Greece; five which were part of the Soviet Union, Estonia, Latvia, Lithuania, Belarus and Ukraine; and seven which had Communist regimes under the heel of Moscow:
Poland, Czechoslovakia, Hungary, Romania, Bulgaria, Albania and Yugoslavia (with multiple states).
The twenty-one peoples – 22 nations – have been grouped as it struck this writer and thirteen sub-groups appear plausible:
one for N1c1, six for R1a, three for I2a1, two for E1b1b and one for J2.
Though this is in regard to predominant paternal Haplogroups, for it is only R1a which is the defining marker Haplogroup for northern and southern Slavic peoples.
I2a1 is a secondary European Haplogroup; whereas E1b1b and J2 are Canaanite and Hamitic mutations from either ancient or recent admixture and N1c1 is a similar non-European group resulting from intermixing with an East Asian line descending from Japheth.
Finland: N1c1 [61.5%] – I1[28%] – R1a [5%] –
R1b [3.5%] – I2a2 [0.5%] – E1b1b [0.5%]
Estonia: N1c1 [34%] – R1a [32%] – I1 [15%] – R1b [8%] –
T1a [3.5%] – I2a1 [3%] – E1b1b [2.5%] – J2 [1%] –
I2a2 [0.5%] – Q [0.5%]
Latvia: R1a [40%] – N1c1 [38%] – R1b [12%] – I1 [6%] –
I2a1 [1%] – I2a2 [1%] – E1b1b [0.5%] – J2 [0.5%] –
T1a [0.5%] – Q [0.5%]
Lithuania: N1c1 [42%] – R1a [38%] – I1 [6%] – I2a1 [6%] –
R1b [5%] – I2a2 [1%] – E1b1b [1%] –
T1a [0.5%] – Q [0.5%]
The consensus is that the Finns and Estonians are more similar as per a PCA graph, though the Y-DNA Haplogroups show Estonia and Lithuania are actually more closely related. All three Baltic nations obviously form one group and three divisions within it, with Latvia and Lithuania closer together and Estonia closer to Finland. Recall that when comparing mtDNA Haplogroups, it was Finland which is closer to Latvia, then followed by Lithuania and lastly, Estonia.
Many – this writer included – have assumed Finland as a Nordic and not a Scandinavian country, and not having been under the umbrella but merely the shade of the Soviet Union’s Iron Curtain, was a truly Western European Nation. In fact, biblical identity adherents have nearly always postulated that Finland is one of the twelve sons of Jacob, namely the tribe of Issachar.
It was realised early during this writer’s study that Finland was not a lost tribe of Israel. It has taken considerably longer to identify the Finns more accurately. It was thought for a prolonged period that they were in fact a son of Abraham, descending from his wife Keturah. Identity adherents could have remonstrated against current arguments, twenty-five years ago perhaps. Genetic and Haplogroup studies of the past twenty years prove beyond a shadow of doubt, that Finland is neither descended from Isaac or from Abraham.
Though the enigma of the Finns does not end there. Recall, we mentioned that Arphaxad had other sons, including Anar and Ashcol as well as daughters. With mtDNA Haplogroup U5, the Finns stand out from the rest of Arphaxad’s children with considerably higher levels. So it is with the Y-DNA Haplogroups N1c1 and I1, where the percentage levels are extraordinarily high in Finland compared to either their Scandinavian or Baltic nation neighbours.
Abraham had a second wife after his first wife Sarah died. Her name was Keturah and she gave Abraham six sons. Her lineage is not provided in the Bible, though Haplogroups of certain nations in Europe strongly indicate that Keturah was from Arphaxad’s line but not from one of Abraham’s brothers, that is, from Peleg or even directly from Joktan’s line. This means Keturah was not from Arphaxad’s son Shelah, but someone related to Shelah; someone such as one of his brothers: Anar or Ashcol.
We will return to this discussion again in Chapter XXVII Abraham & Keturah – Benelux & Scandinavia.
The main point to consider is that the Finns are unique genetically; including their language group Finno-Ugric, which they share with Hungary. In fact, Hungarian has roots all the way back to Sumer, which supports the notion that descendants of Arphaxad at one time, peopled Sumer and northern neighbouring Akkad – refer Chapter XVI Shem Occidentalis; and Chapter XVIII Elam & Turkey.
N1c1 R1a I1 R1b I2a1 I2a2 J2 E1b1b
Finland 62 5 28 4 0.5 0.5
Estonia 34 32 15 8 3 0.5 1 3
Lithuania 42 38 6 5 6 1 1
Latvia 38 40 6 12 1 1 0.5 0.5
The table comparing Finland and the Baltic states with the nations which exhibit very high percentages of the N1c1 Haplogroup; confirming the uniqueness of Finland and the closeness of the Baltic nations with one another. Even so, R1a (Z280) is the true paternal lineage for the three Baltic nations.
Whereas for Finland it is I1, with the more prevalent N1c1 being an infusion from intermixing. Latvia is included in this group as the difference between N1c1 and R1a is marginal. They also share a complete lack of Haplogroup G2a – an older line again from Shem than either I or R1a – which is indicative of southern Europe, Anatolia and especially the Caucasus.
Khazaria, Kevin Alan Brook – emphasis mine:
‘Swedish Population Substructure Revealed by Genome-Wide Single Nucleotide Polymorphism Data, multiple authors, 2011:
The autosomal DNA genomes of 1,525 Swedes were autosomally compared to 280 Finns (from both Eastern Finland and Western Finland) along with Germans, Brits, and Russians.’
“… the Finns seem to be an exception to this rule: they do not appear genetically very close to the Swedes although they are geographically nearby. However, the Finns tend to show inflated genetic distances relative to [all] the [other] European populations in general, not only relative to the Swedes… Northern Swedes and Eastern Finns exhibited longer genetic distances than their geographic location would imply… Of the Swedes, Norrland and Svealand individuals were closest to Finns, and the Finns who had closest affinity to the Swedes were mainly Swedish-speaking Ostrobothnians (SSOB).
Interestingly, the neighboring Swedish and Finnish provinces in the north, Norrbotten (NBO) and Northern Ostrobothnia (NOB), did not appear very close in the MDS plot; instead, Norrbotten seemed to show closer affinity to Western Finland… The principal component analysis clearly separated the Finnish regions and Eastern and Western counties from the Swedish as well as the Finnish regions and counties from each other. Geneland showed three clusters, roughly corresponding to Sweden, Eastern Finland and Western Finland.”
‘MtDNA diversity revealed that Lithuanians are close to both Slavic (Indo-European) and Finno-Ugric speaking populations of Northern and Eastern Europe. Y-chromosome SNP haplogroup analysis showed Lithuanians to be closest to Latvians and Estonians’
Belarus: R1a [51%] – I2a1 [17.5%] – N1c1 [10%] – R1b [5.5%] –
I1 [5.5%] – E1b1b [4%] – J2 [2.5%] – G2a [1.5%] –
I2a2 [1%] – J1 [1%]
Ukraine: R1a [44%] – I2a1 [20.5%] – R1b [8%] – E1b1b [6.5%] –
N1c1 [5.5%] – I1 [4.5%] – J2 [4.5%] – G2a [3%] – T1a [1%] –
I2a2 [0.5%] – J1 [0.5%] – Q [0.5%]
Moldova: R1a [30.5%] – I2a1 [21%] – R1b [16%] – E1b1b [13%] –
I1 [5%] – J2 [4%] – J1 [4%] – I2a2 [3%] – N1c1 [1.5%] –
G2a [1%] – T1a [1%]
Poland: R1a [57.5%] – R1b [12.5%] – I1 [ 8.5%] – I2a1 [5.5%] –
N1c1 [4%] – E1b1b [3.5%] – J2 [2.5%] – I2a2 [2%] –
G2a [1.5%] – T1a [0.5%] – Q [0.5%]
Czech R: R1a [33%] – R1b [28%] – I2a1 – [8.5%] – I1 [7.5%] –
E1b1b [6.5%] – G2a [5%] – J2 [4%] – I2a2 [3%] –
N1c1 [2.5%] – J1 [1%] – T1a [0.5%]
Slovakia: R1a [41.5%] – I2a1 [16%] – R1b [14.5%] – I1 [6.5%] –
E1b1b [6.5%] – G2a [4%] – N1c1 [3%] – J2 [2%] –
I2a2 [1.5%] – J1 [1%] – T1a [0.5%] – Q [0.5%]
Slovenia: R1a [38%] – I2a1 [20.5%] – R1b [18%] –
I1 [9%] – E1b1b [5%] – J2 [2.5%] – I2a2 [1.5%] –
G2a [1.5%] – T1a [1%]
Hungary: R1a [29.5] – R1b [18.5] – I2a1 [16%] – I1 [8.5%] –
E1b1b [8%] – J2 [6.5%] – G2a [3.5%] – J1 [3%] –
I2a2 [2%] – N1c1 [0.5%]
The second group of countries dominated by the R1a (Z282) Haplogroup, primarily comprise the western and eastern Slavs. The maternal mtDNA showed a close alignment between the Czechs and Slovaks, whereas the paternal Y-DNA Haplogroups reveal a wider variation; with the Slovaks having more in common with Slovenia and the Czechs with Hungary. Overall on a PCA graph, the Czechs and Slovaks are genetically closer; while the Hungarians are closer with Slovenians.
Conversely from the mtDNA data, Belarus and Ukraine are not quite as similar, with Ukraine showing a similarity with Slovakia. Overall, Ukraine is relatively speaking, equally most related with Poles, Belorussians and Russians.
Poland is at the far northwest region of Joktan’s children and carries the highest percentage of R1a. The Poles and Czechs have each had territory which has intermingled with Germany, before, during and after German and Prussian expansion. The Magyars of Hungary have been closely associated with the Austrians – a descendant of Peleg – during the Hapsburg ruled Austro-Hungarian Empire.
One researcher states that the Hungarian language of Magyar is utterly unique in the world and is actually the closest to ancient Sumerian. As mentioned, the sons of Joktan settled in lower Mesopotamia and became known as Sumerians; while their cousins from Peleg, were known as Akkadians.
R1a I2a1 R1b I1 N1c1 I2a2 E1b1b J2
Poland 58 6 13 9 4 2 4 3
Belarus 51 18 6 6 10 1 4 3
Ukraine 44 21 8 5 6 0.5 7 5
Slovakia 42 16 15 7 3 1.5 7 2
Slovenia 38 21 18 9 1.5 5 3
Czech R. 33 9 28 8 3 3 7 4
Moldova 31 21 16 5 1.5 3 13 4
Hungary 30 16 19 9 0.5 2 8 7
For the Baltic nations and Finland, the principal Y-DNA Haplogroups include N1c1, R1a and I1. All reflective of their positions as northern as well as eastern European nations. As we travel from north to south the Haplogroup N1c1 markedly decreases; whereas E1b1b and J2 increase. The impact of the mixed Huns or Turks is evident in this admixture, which left the Baltic nations untouched. Heading east and south it is Haplogroup R1a which dominates, while travelling west, R1b expectedly increases.
The principal Y-DNA Haplogroups for the central Slavic speaking peoples include R1a (Z283), I2a1 and R1b. Notice from the previous group the omission of the northern Haplogroups of N1c1 and I1. Haplogroup R1a – reflective of eastern European males – is prominent as is the older I2a1, which is indicative of eastern Europe and particularly south eastern Europe. Polish men exhibit the highest levels of R1a and the Czechs the highest percentage of R1b in Eastern Europe – likely revealing German admixture.
Khazaria, Kevin Alan Brook – emphasis & bold mine
‘Paleo-Balkan and Slavic Contributions to the Genetic Pool of Moldavians: Insights from the Y Chromosome, multiple authors, 2013 – emphasis & bold mine:
This study included 125 Y-DNA samples from Moldavian males from the villages of Karahasani and Sofia and they were compared to other European populations including 54 Romanians living in eastern Romania and 53 Ukrainians living in eastern Moldova.’
“… In Moldavians, 19 Y chromosome haplogroups were identified, the most common being I-M423 (20.8%), R-M17* (17.6%), R[1a1a1b1a1]-M458 (12.8%), E-v13 (8.8%), R[1b]-M269* and R-M412* (both 7.2%).
In Romanians, 14 haplogroups were found including I-M423 (40.7%), R-M17* (16.7%), R-M405 (7.4%), E-v13 and R-M412* (both 5.6%).
In Ukrainians, 13 haplogroups were identified including R-M17 (34.0%), I-M423 (20.8%), R-M269* (9.4%), N-M178, R-M458 and R-M73 (each 5.7%).
Our results show that a significant majority of the Moldavian paternal gene pool belongs to eastern/central European and Balkan/eastern Mediterranean Y lineages. Phylogenetic and AMOVA analyses based on Y-STR loci also revealed that Moldavians are close to both eastern/central European and Balkan-Carpathian populations [particularly Croatian men].”
“All Slovenian samples group together with Hungarians, Czechs, and some Croatians (‘Central-Eastern European’ cluster) as also suggested by the PCA… Analysis of the UPGMA tree based on the Fst matrix shows all Slovenian individuals clustering together with Hungarians, Czechs, Croatians, Ukrainians, and Belarusians… Y chromosome diversity splits into two major haplogroups R1b and R1a with the latter suggesting a genetic contribution from the steppe.
Slovenian individuals are more closely related to Northern [Austrian] and Eastern European [Hungary] populations than Southern European populations even though they are geographically closer.”

Croatia: I2a1 [37%] – R1a [24%] – E1b1b [10%] – R1b [8.5%] –
J2 [6%] – I1 [5.5%] – G2a [2.5%] – I2a2 [1%] – J1 [1%] –
Q [1%] – N1c [0.5%] – T1a [0.5%]
Bosnia & Herzegovina: I2a1 [50.5% ] – R1a [18%] – E1b1b [11.5%] –
J2 [5.5%] – I1 [4.5%] – R1b [3.5%] – G2a [1.5%] – J1 [1%] –
N1c [1%] – T1a [0.5%] – Q [0.5%]
Serbia: I2a1 [34%] – R1a [18%] – E1b1b [15%] – J2 [9%] –
I1 [8%] – R1b [6%] – G2a [2.5%] – N1c [2.5%] – J1 [1%] –
Q [1%] – I2a2 [0.5%] – T1a [0.5%]
Montenegro: I2a1 [29.5%] – E1b1b [27%] – R1b [9.5%] –
J2 [9%] – R1a [7.5%] – I1 [6%] – G2a [2.5%] – Q [2%] –
I2a2 [1.5%] – N1c [1.5%] – J1 [0.5%]
Macedonia: I2a1 [23%] – E1b1b [21.5%] – J2 [14%] – R1a [13.5%] –
R1b [12.5%] – G2a [4%] – I1 [3%] – J1 [2%] – I2a2 [1.5%] –
T1a [1.5] – Q [0.5%] – N1c [0.5%]
Romania: I2a1 [28%] – R1a [18%] – R1b [15.5%] – E1b1b [14%] –
J2 [13.5%] – I1 – [3.5%] – G2a [3%] – I2a2 [2.5%] –
N1c [1.5%] – J1 [1%] – T1a [1%] – Q [0.5%]
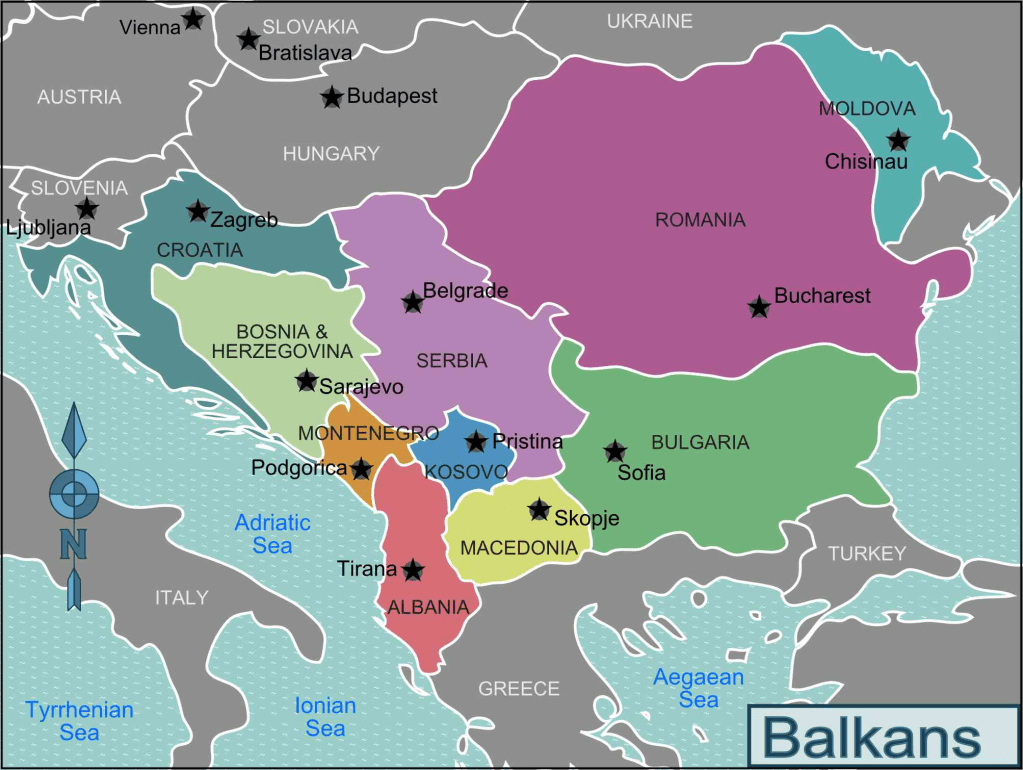
The third group possessing higher percentages of the older (intermediate) I2a1 Haplogroup, consists of nations in south eastern Europe.
Distinct groupings are visible from former Yugoslavian states. Some researchers have compared Romania and Bulgaria as being similar, yet they both stand out as quite distinct from other eastern European or south eastern European nations. Bulgaria is equally distant from Macedonia and Romania on the PCA graph.
The principle Y-DNA Haplogroups for these six nations are I2a1, R1a and E1b1b. The higher levels of E1b1b and J2 are reminiscent of say Portugal or Turkey respectively. By far the highest percentage of I2a1 is found in Bosnia Herzegovina.
I2a1 R1a E1b1b J2 R1b I1 I2a2 N1c
Bosnia & H. 51 18 12 6 4 5 1
Croatia 37 24 10 6 9 6 1 0.5
Serbia 34 18 15 9 6 8 0.5 3
Montenegro 30 8 27 9 10 6 1.5 1.5
Romania 28 18 14 14 16 4 3 1.5
Macedonia 23 14 22 14 13 3 1.5 0.5
It could be argued that these nations and particularly the Balkan states remaining after the implosion of the former Yugoslavia are like Finland, descendants of Arphaxad through his sons Anar or Ashcol; with Haplogroup I the common denominator.
Khazaria, Kevin Alan Brook – emphasis & bold mine:
‘I2a (I-P37.2), [the] most common haplogroup, found among 29.2% of Serbian Serbs and 30.9% of Bosnian-Herzegovinian Serbs. It peaks in the Herzegovina region. Other Slavic peoples also carry I2a. Geneticists believe that I2a ultimately originated in the Balkans about 10,000 years ago… 720 Croatian males had their Y-DNA examined… and compared with thousands of samples from different European ethnicities.
Many different haplogroups were found among the Croats, yet 3 haplogroups stood out as particularly distinctive:
I2a1b-M423 (found in over 30% of the Croatian samples and the most indigenous to the region),
R1a1a1b1a*-M558 (found in 19% of the Croats…) and
E1b1b1a1b1a-V13 (found in about 9% of the Croats…)
This Y chromosomal study compares Croats with Slovenians, Serbs, Macedonian Slavs, Macedonian Greeks, Albanians, Poles… [and] reports that among 108 studied mainland Croatians their frequencies are 15.7% belonging to R1b-M173 [and] 34.3% to R1a-M17…’
Kosovo: E1b1b [47.5%] – R1b [21%] – J2 [16.5%] –
I1 [5.5%] – R1a [4.5%] – I2a1 [2.5%]
Bulgaria: E1b1b [23.5%] – I2a1 [20%] – R1a [17%] – R1b [11%] –
J2 [11%] – G2a [5%] – I1 [4%] – J1 [3%] – I2a2 [2%] –
T1a [1.5%] – Q [0.5%] – N1c [0.5%]
Albania: E1b1b [27.5%] – J2 [19.5%] – R1b [16%] –
I2a1 [12%] – R1a [9%] – I1 [2%] – J1 [2%] –
I2a2 [1.5%] – G2a [1.5%] – T1a [1%]
Greece: J2 [23%] – E1b1b [21%] – R1b [15.5%] – R1a [11.5%] –
I2a1 [9.5%] – G2a [6.3%] – T1a [4.5%] – I1 [3.5%] –
J1 [3%] – I2a2 [1.5%]
The final grouping driven by high percentages of E1b1b and J2 includes Kosovo, which emerged out of the ruins of the fragmented Yugoslavia.
Most have always assumed Greece is a western nation and like Finland, it was not under Soviet domination. Yet, its Haplogroups show that it belongs where it is located, with its fellow brothers, the sons of Joktan. With that said, the Greeks reveal considerable diversity from admixture amongst the mainland and island populations. Additionally, they are genetically similar with not just Albanians but also southern Italians and Jews.
We will investigate this further in the following chapter – Chapter XXV Italy: Nahor & the Chaldeans.
For we will confirm there is more than one branch or family in the Bible with the name Uz – refer Chapter XXIII Aram & Tyre: Spain, Portugal & Brazil; and Chapter XXIX Esau: The Thirteenth Tribe.
E1b1b J2 R1b I2a1 R1a I1 I2a2 N1c
Kosovo 48 17 21 3 5 5
Albania 28 20 16 12 9 2 1.5
Bulgaria 24 11 11 20 17 4 2 0.5
Greece 21 23 16 10 12 4 1.5
The predominant Y-DNA Haplogroups for these four most south easterly European nations are E1b1b and J2 from admixture with Canaan and Ham respectively and a little surprisingly, R1b. Though this has likely been influenced by males of Turkish descent – refer Chapter XVIII Elam & Turkey.
For the first time R1a drops out of the top three. Haplogroup I2a1 is still relatively prominent, as the neighbouring nations to the north west. Bulgaria with the closeness between Haplogroups E1b1b and I2a1 could be included in the preceding group; as Greece is included here, rather than a separate group of one with J2. Its dominant J2 Haplogroup places it near J2 dominated Turkey, 24%; and Iran, 23%.
Bulgarian Autosomal DNA lends weight to its inclusion with Romania and the Balkan states. Greece with Albania and Kosovo has a strong presence of R1b and thus like Turkey, their true paternal lineage is possibly R1b when one discounts E1b1b and J2 from admixture. Kosovo possesses the highest percentage of E1b1b.
An alternative is that R1a as with Iran could be the definitive paternal marker Haplogroup and R1b a sign of heavy intermixing. Or, like the rest of the Balkans (as highlighted below), Greek males are actually defined by Haplogroup I2a1.
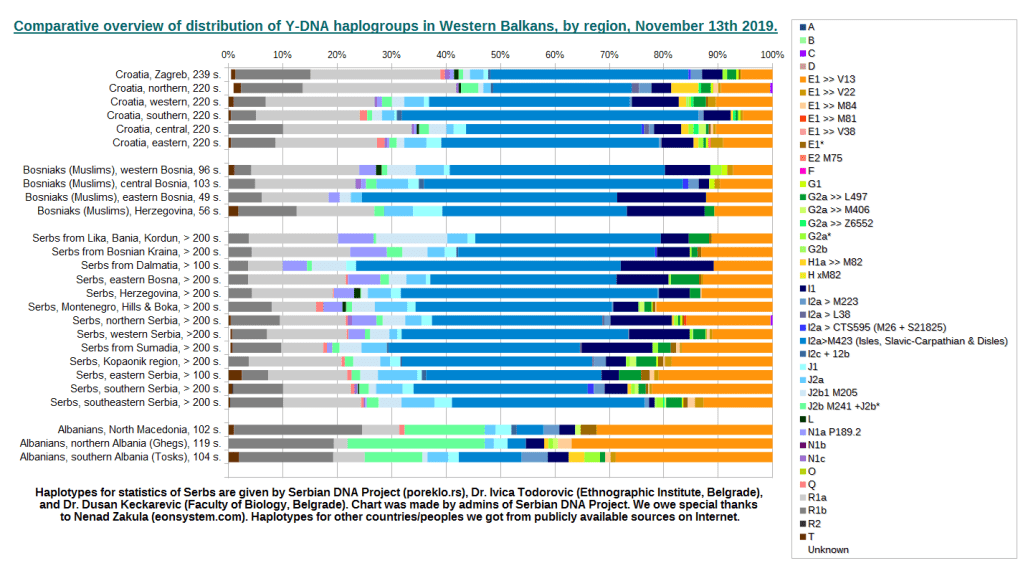
The PCA graph earlier confirms two points.
First, the wide diverseness of the Eastern Europeans stretching from the Baltic to the extremity of the Balkans and yet also, within this sizeable region and its numerous nations, are the thirteen sons of Joktan. All showing their interrelatedness through primarily Haplogroup R1a-Z283.
Whereas I1 and I2a1 are reflective of Arphaxad and not necessarily of Joktan.
As we progress through the descendants of Shem, we will find the levels of R1b vary, though gradually increase. We will keep a record of the levels for the two main R1b sub-Haplogroups for a number of the nations we will study. R-M269 stretches across Europe, with levels increasing as one heads westwards. R-U106 covers western Europe eastwards with its epicentre in Central Europe.
Turkey: R-M269 14% – R-U106 0.4%
Russia: R-M269 21% – R-U106 5.4%
Slovenia R-M269 17% – R-U106 4%
Czech R-M269 28% – R-U106 14%
Poland R-M269 23% – R-U106 8%
Ukraine R-M269 25% – R-U106 9%
The addition of the Slavic speaking nations with Turkey and Russia highlights the progression of R1b from east to west as well as south to north. Slovenia is the most southern country of the four represented yet also the most westerly. Its R-M269 level is closer to Turkey, though its R-U106 percentage is closer to Russia.
Like the other three, R1a is the prime male Haplogroup and as with Ukraine, Haplogroup I2a1 is second. Ukraine has a R-M269 level similar to Russia, though its R-U106 percentage is higher. Poland is similar with Ukraine, whereas the Czechs stand out with higher levels of R-M269 and R-U106.
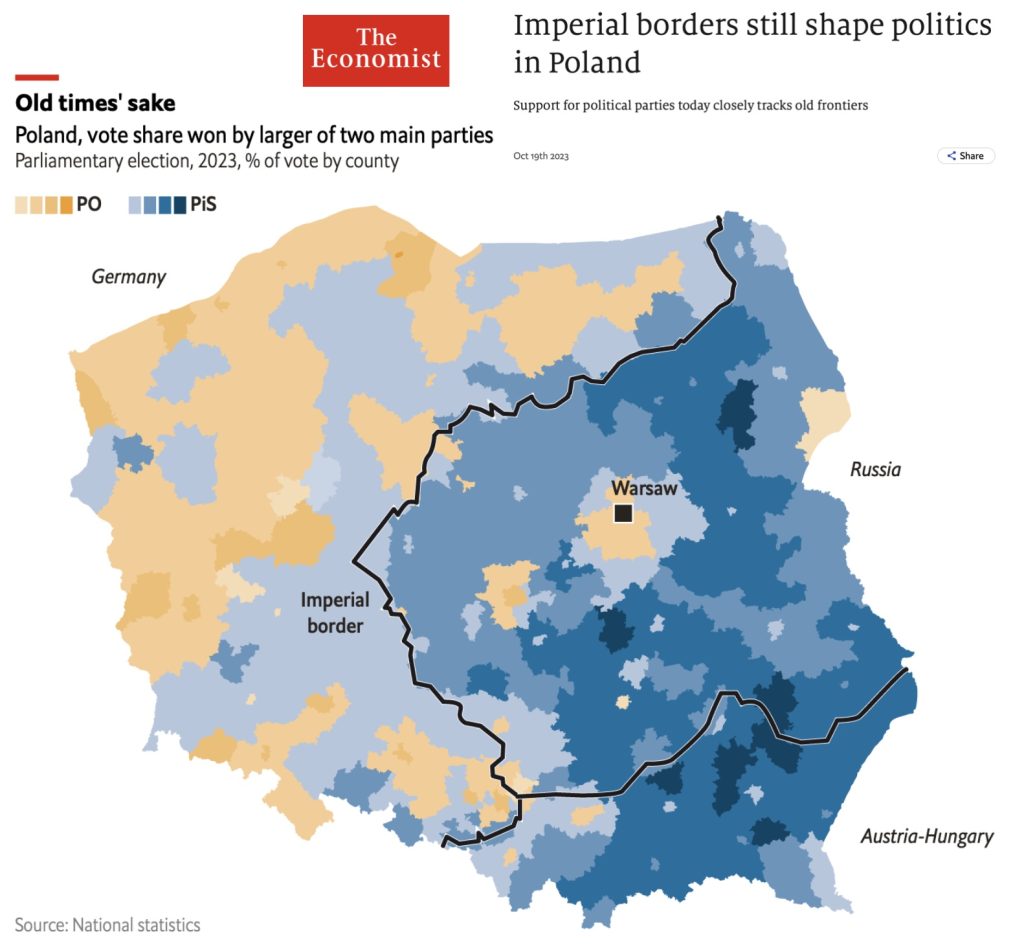
How much of this has been influenced by their border changes with Germany and mixing of peoples is undetermined, yet cannot be dismissed as shown above. Like Poland, the Czech Republic has Haplogroup R1a first and R1b second instead of I2a1. The Czech Republic has less R1a than the other three Slav nations listed above and conversely, more R1b than any other nation descending from Joktan; with Poland possessing the highest levels of R1a of all of Joktan’s descendants – and perhaps the true epicentre.
Other Eastern European nations percentage of R-M269 include the following:
Bulgaria R-M269 10.5%
Croatia R-M269 12.4%
Romania R-M269 13.0%
Greece R-M269 13.5%
Moldova R-M269 14.6%
Albania R-M269 18.2%

The evolving table from the previous chapter, compared certain nations descended from Aram with Asshur, Elam and Lud.
Now with the addition of the select nations from the scriptures discussed in this chapter and descending from either Arphaxad or via his great grandson, Joktan.
J J1 J2 E1b1b G R1a R1b R1
Georgia 43 16 27 2 30 9 10 19
Armenia 33 11 22 6 12 5 30 35
Turkey 33 9 24 11 11 8 16 24
Iran 32 9 23 7 10 16 10 26
Greece 26 3 23 21 6 12 16 28
Romania 15 1 14 14 3 18 16 34
Portugal 13 3 10 14 7 1.5 56 58
Brazil 10 10 11 5 4 54 58
Spain 10 1.5 8 7 3 2 69 71
Ukraine 5 0.5 4.5 7 3 44 8 52
Poland 3 3 4 2 58 13 71
Russia 3 3 3 1 46 6 52
Finland 0.5 5 4 9
Georgia continues as one bookend with the highest Haplogroup J2, J1 and G2a percentages. Finland is now the opposite bookend, with no Haplogroup J and the lowest R1 levels.
Poland exhibits the highest percentage of R1a ahead of Russia, while Greece has more E1b1b than Portugal. Spain’s total R1 is equalled by Poland, though in opposite percentages for R1a and R1b. A clear example of the European R1a and R1b Y-DNA divide between the descendants of Aram and Peleg in western Europe and Asshur and Joktan in Eastern Europe. The diverseness of Joktan’s descendants is shown by their slotting in between Elam, Lud and Aram; as well as between Aram and Asshur.
Focussing on the key Y-DNA Haplogroups associated with the majority of the European nations, Haplogroups R1a, R1b, I1 and I2 segment Europe roughly into quarters.
Haplogroup R1b is dominant in the West; R1a in the East; I1 and I2a2 in the North and west; with I2a1 in the South and east.
Added to this, is N1c1 from admixture with Japheth, prevalent in northern Europe and in counter balance to Haplogroups J2 and J1 from Ham, which are more common in southern Europe.
R1a R1b I1 I2a1 I2a2 N1c
Portugal 1.5 56 2 1.5 5
Spain 2 69 1.5 5 1
Brazil 4 54 [9]
Finland 5 4 28 0.5 62
Turkey 8 16 1 4 0.5 4
Greece 12 16 4 10 1.5
Iran 16 10 0.5 1
Romania 18 16 4 28 3 2
Ukraine 44 8 5 21 0.5 6
Russia 46 6 5 11 23
Poland 58 13 9 6 2 4
The comparison table shifts in emphasis when northern European Y-DNA Haplogroups comprising the old Haplogroups of I1 and I2a2 with the ancient Haplogroup G2a (all from Shem) are compared. The paternal Y-DNA diversity within Joktan’s children is repeated. Ukraine and Poland bear closer similarity with Russia from Asshur; and Greece and Romania aligning with Turkey from Elam and Iran from Lud, albeit distantly.
Romania and Ukraine possess significantly higher levels in I2a1 and Poland in Haplogroup R1a. Finland has a seismic difference with all the other peoples, with its high level of I1 and very high percentage in N1c1.
The patterns discerned thus far are substantiated in the comparison tables of major Y-DNA Haplogroups. R1b noticeably increases from east to west. Russia aside from Finland, has the lowest levels and Spain the highest. Haplogroup R1a visibly does the opposite, so that the lowest levels are exhibited in Portugal and Spain, with the highest in Poland, followed by Russia.
The typically northern Haplogroup of N1c1 is virtually non-existent in southern Europe, with Finland and Russia aside from the Baltic nations, having the highest percentages. Haplogroups more commonly associated with peoples from Canaan and Ham – in North Africa, the Middle East and West Asia – comprising E1b1b, J1 and J2 are more prevalent in southern Europe, decreasing northwards. For example, excluding Georgia, Greece has the highest percentage of E1b1b, whereas Finland and Russia the lowest.
Recapping from earlier chapters the defining Y-DNA Haplogroups:
In Iran the dominant paternal Haplogroups are J2 and R1a-Z93;
for Turkey they comprise J2 and R1b-Z2103; whereas in
Russia they include R1a–Z282 and N1c1; for
Brazil, Portugal and Spain, it is R1b-DF27; and additionally the
Baltic, Slavic, Balkan nations are R1a-Z283, I2a1 and I1.
Finally, gauging by Haplogroup R1a percentages over 30% for instance, there are eleven prominent nations. Locating thirteen ethnic lines as individual countries is clearly a pitfall.
Groupings of related ethnic lines according to autosomal DNA, contained in the regional split between the Southern region of the Balkans and the Northern area east of the Baltic, results in the following:
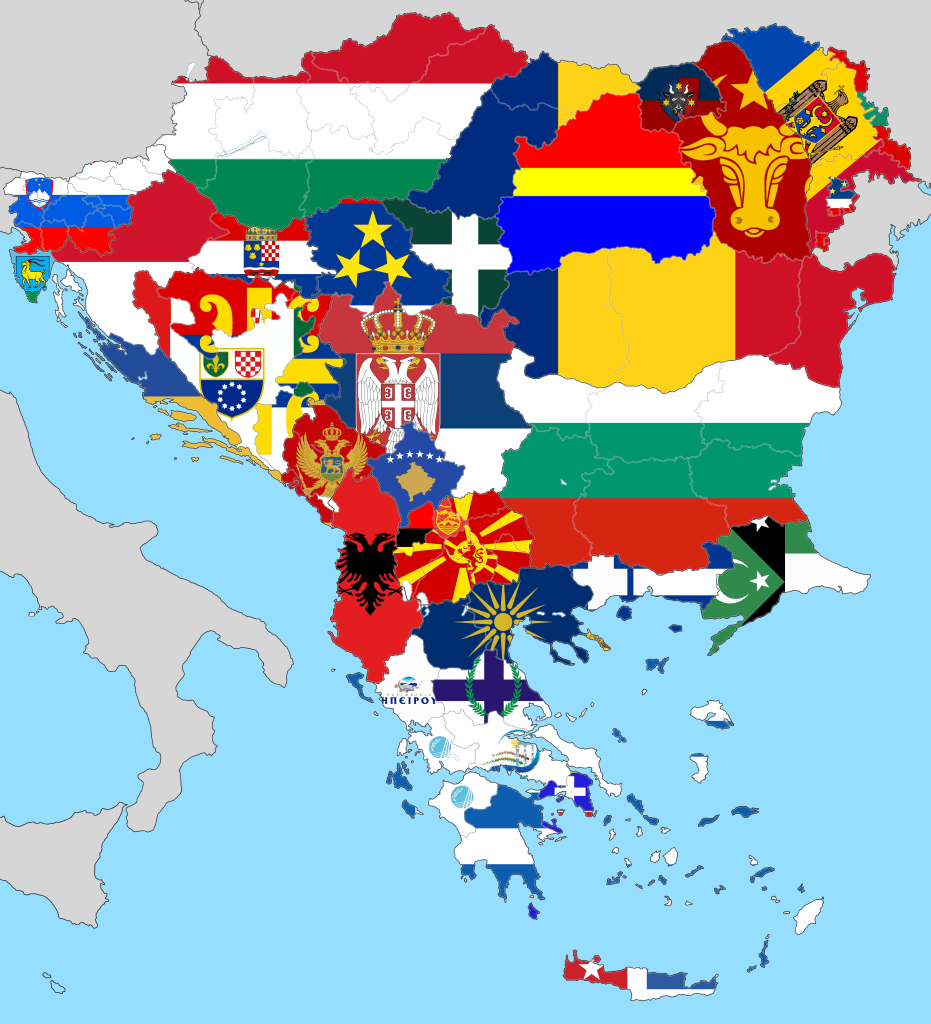
Southern region of the Balkans (above)
Greece, Albania (Kosovo) [1], North Macedonia, Bulgaria [2], Romania, Moldova [3], Bosnia [4], Serbia (Montenegro) [5], Croatia [6], Slovenia, Hungary [7]

Northern area east of the Baltic (above)
Slovakia, Czech [8], Ukraine [9], Poland [10], Belorussia [11], Lithuania, Latvia [12], Estonia (Finland) [13].
The next chapter focuses on Joktan’s elder brother Peleg and specifically his descendants through Abraham’s brother, Nahor.
Trust in the Lord with all your heart, and do not lean on your own understanding. In all your ways acknowledge him, and he will make straight your paths.
Proverbs 3:5-6 English Standard Version
“Wrong does not cease to be wrong because the majority share in it.”
Leo Tolstoy 1828-1910
© Orion Gold 2021 – All rights reserved. Permission to copy, use or distribute, if acknowledgement of the original authorship is attributed to orion-gold.com